Week 03 - From pictures to numbers

Prof. C. Austin Davis

Spring 2025

Roadmap for today

  • Quiz
  • Review at-home problems
  • Rank statistics with US Income
  • Mutated means with mental health data
  • Spread with US DoS electricity usage
  • Preview of next time

Quiz

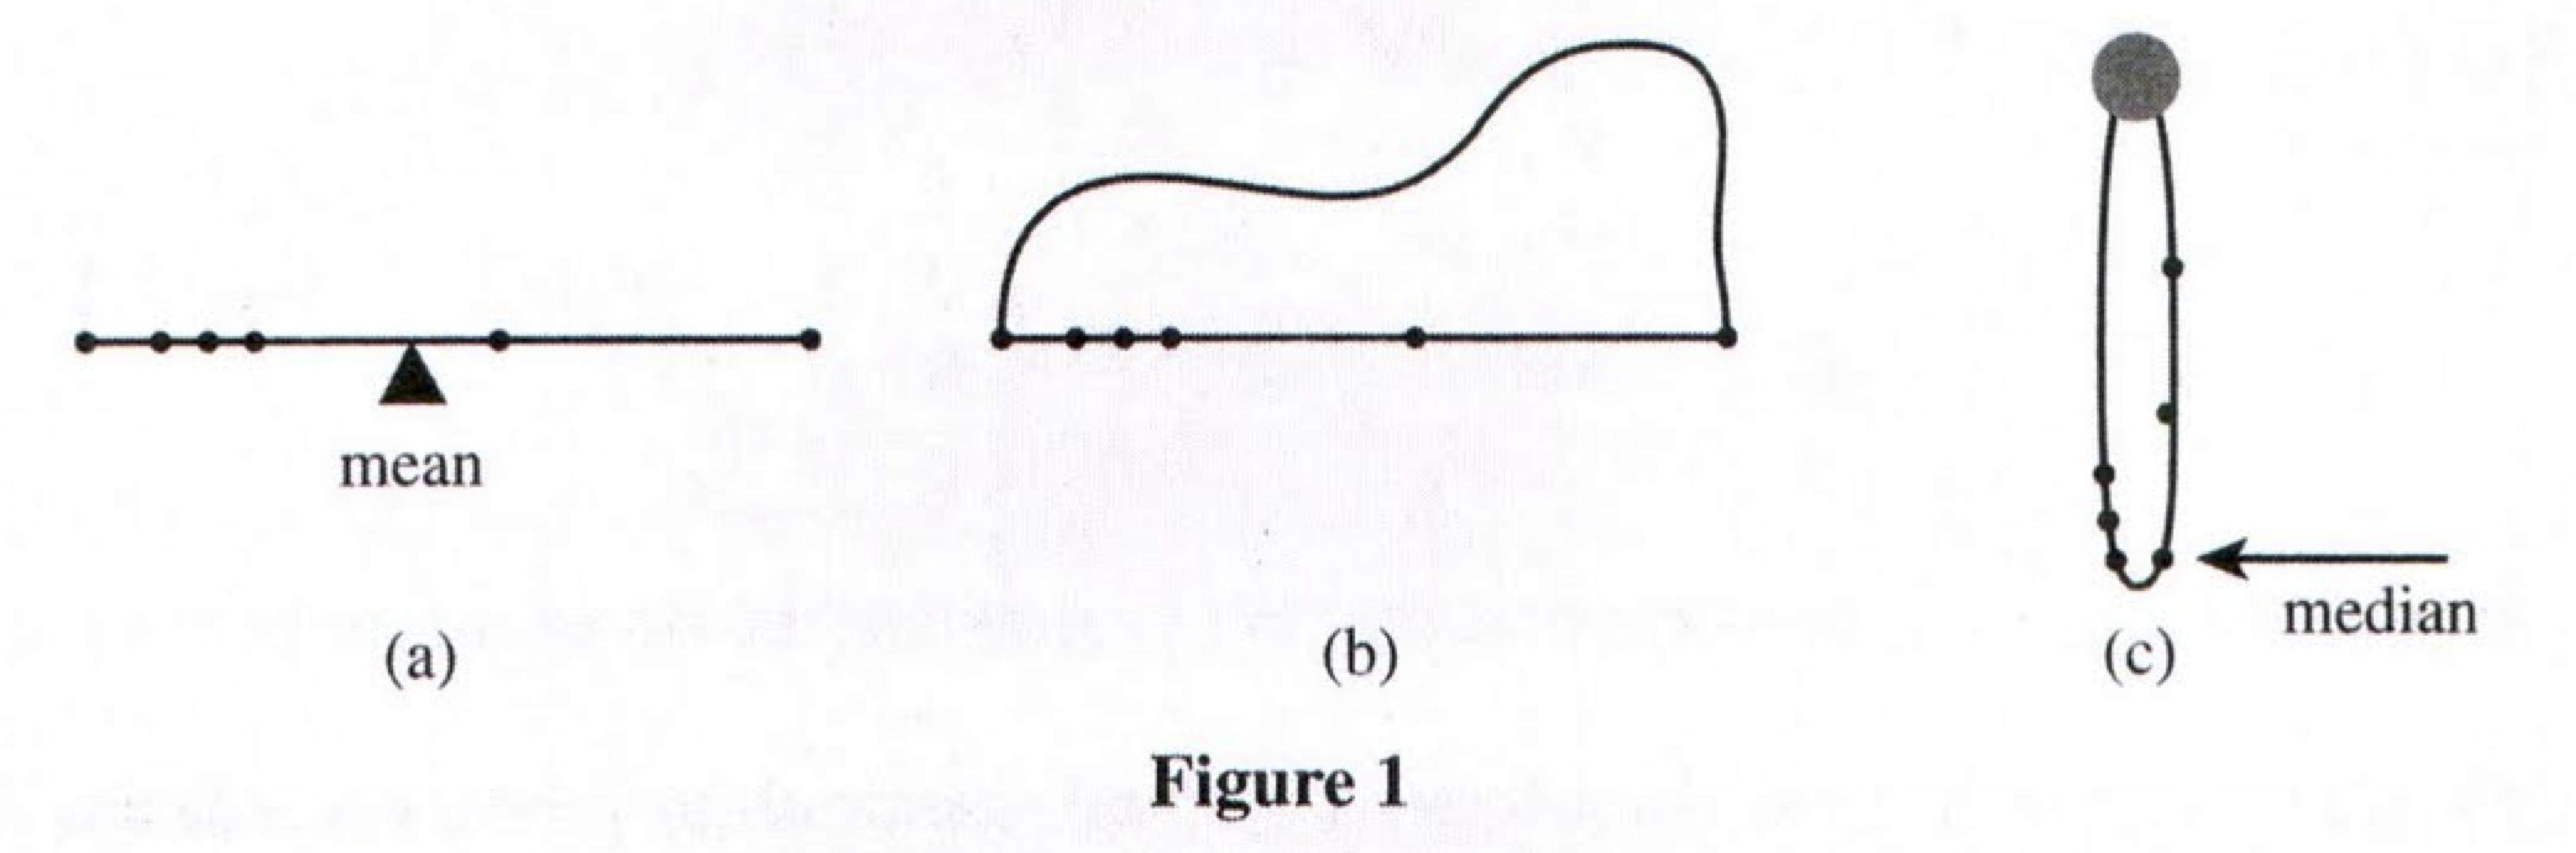
Mean vs. median

  • Mean balances a rod
  • Median balances a string

At-home problems

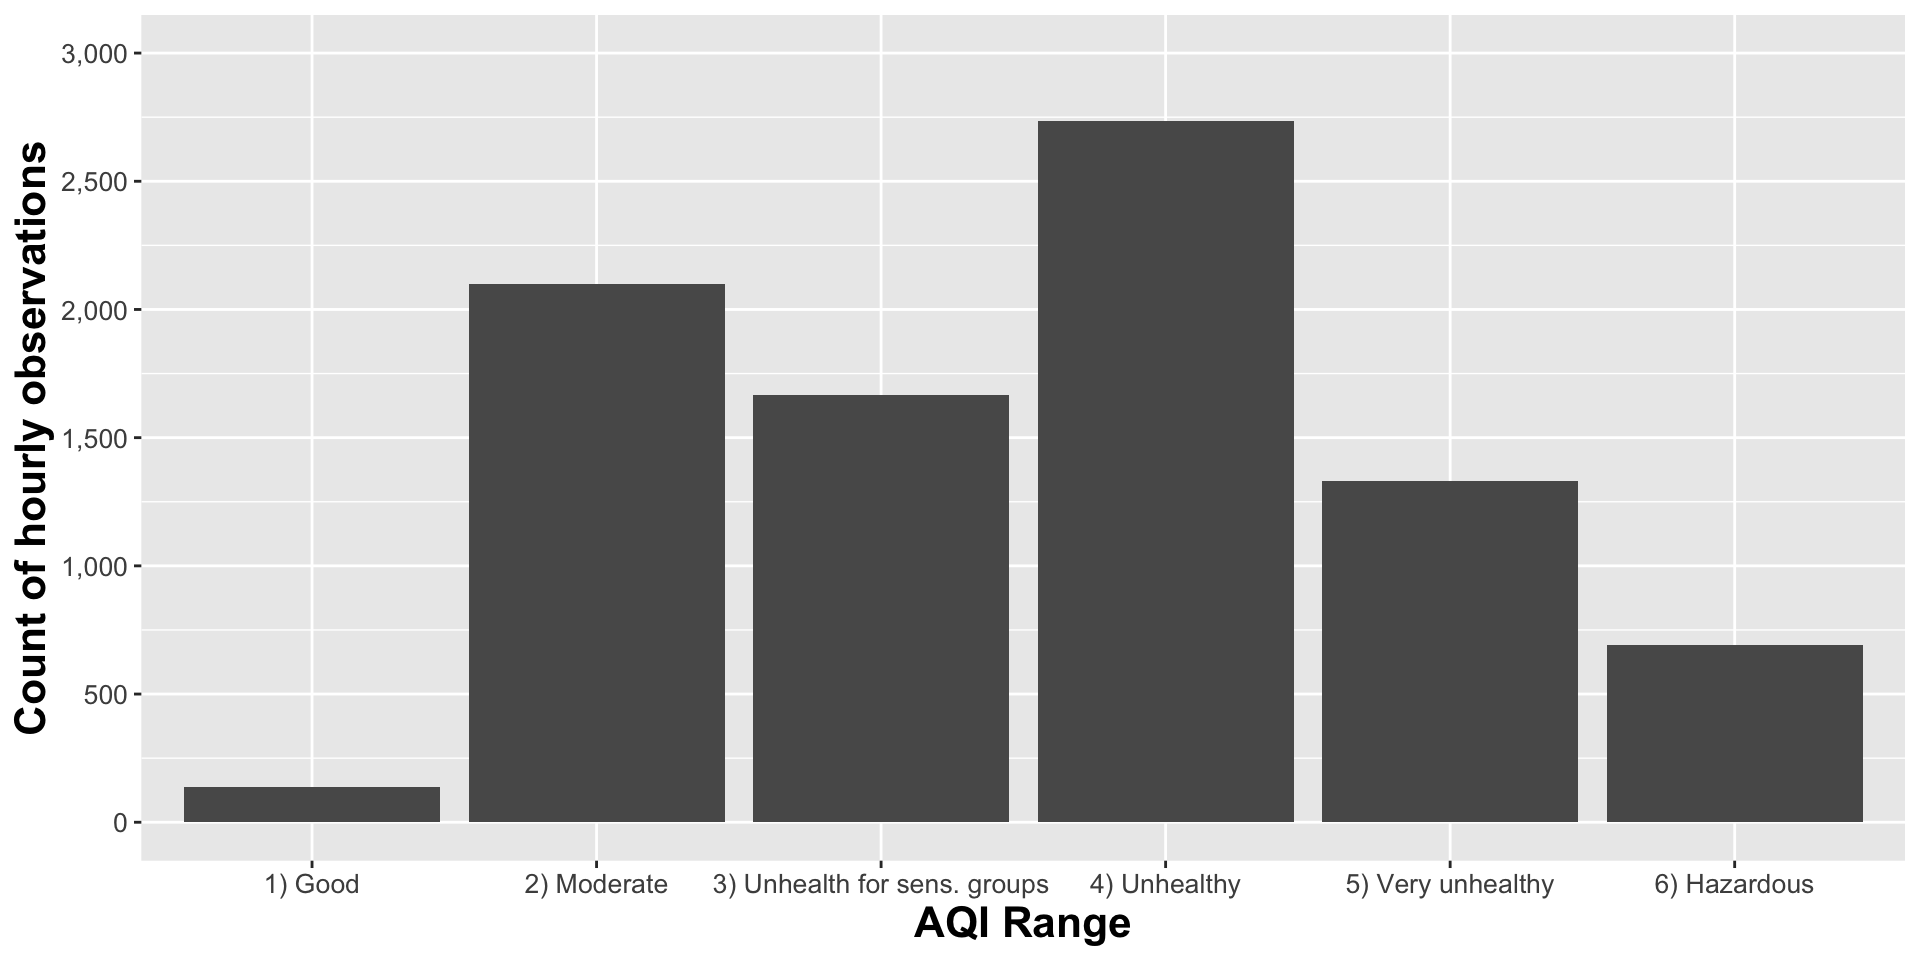
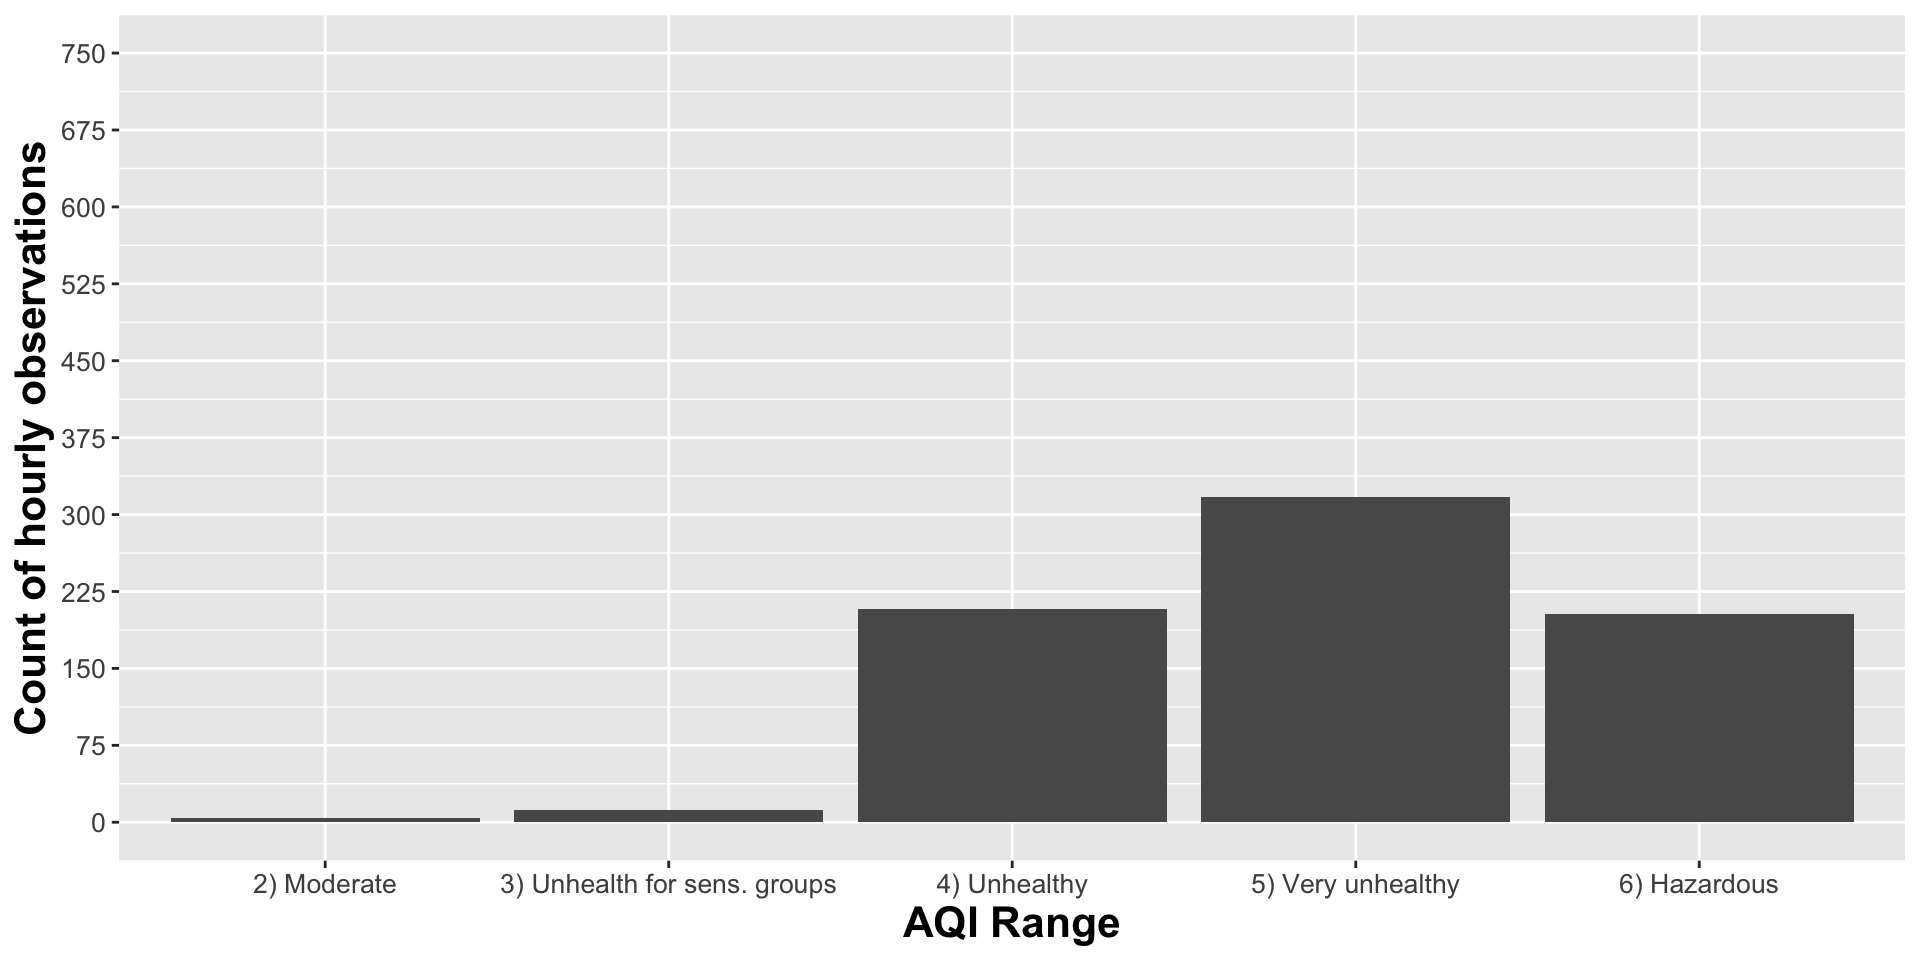
Air quality in Delhi

Air quality in September
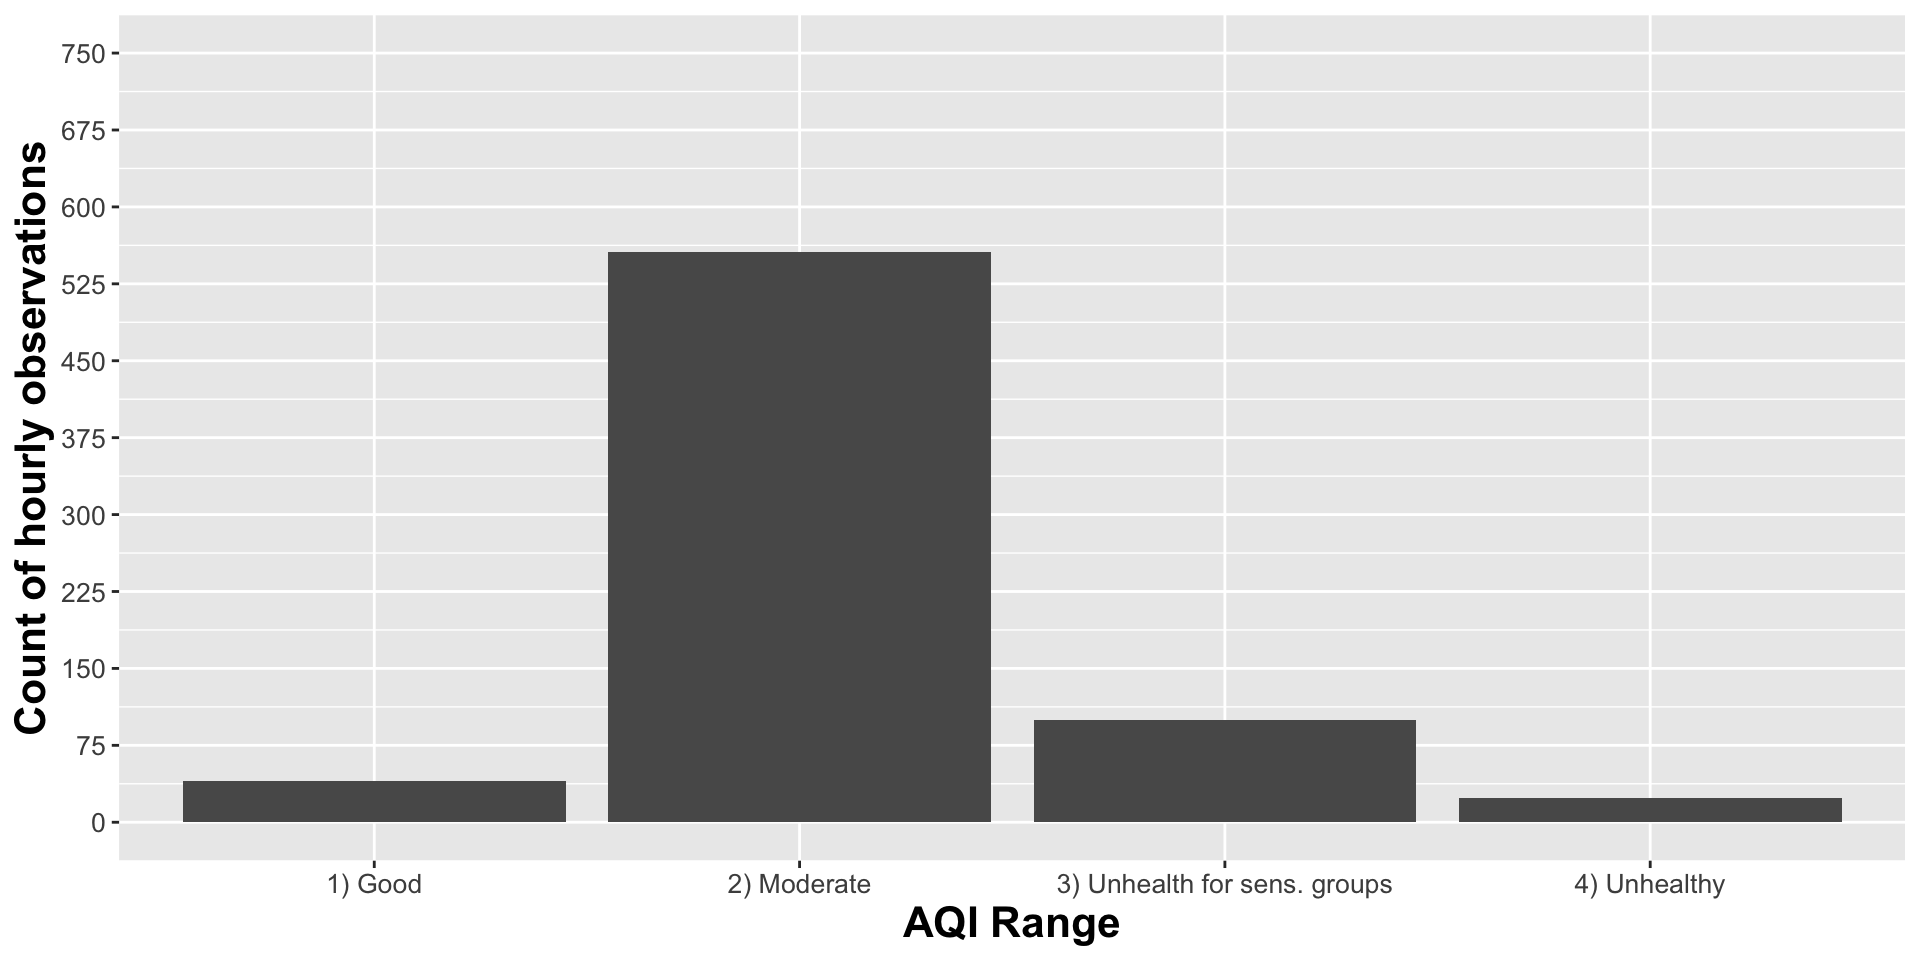
Air quality in January
Distributions display a lot of information

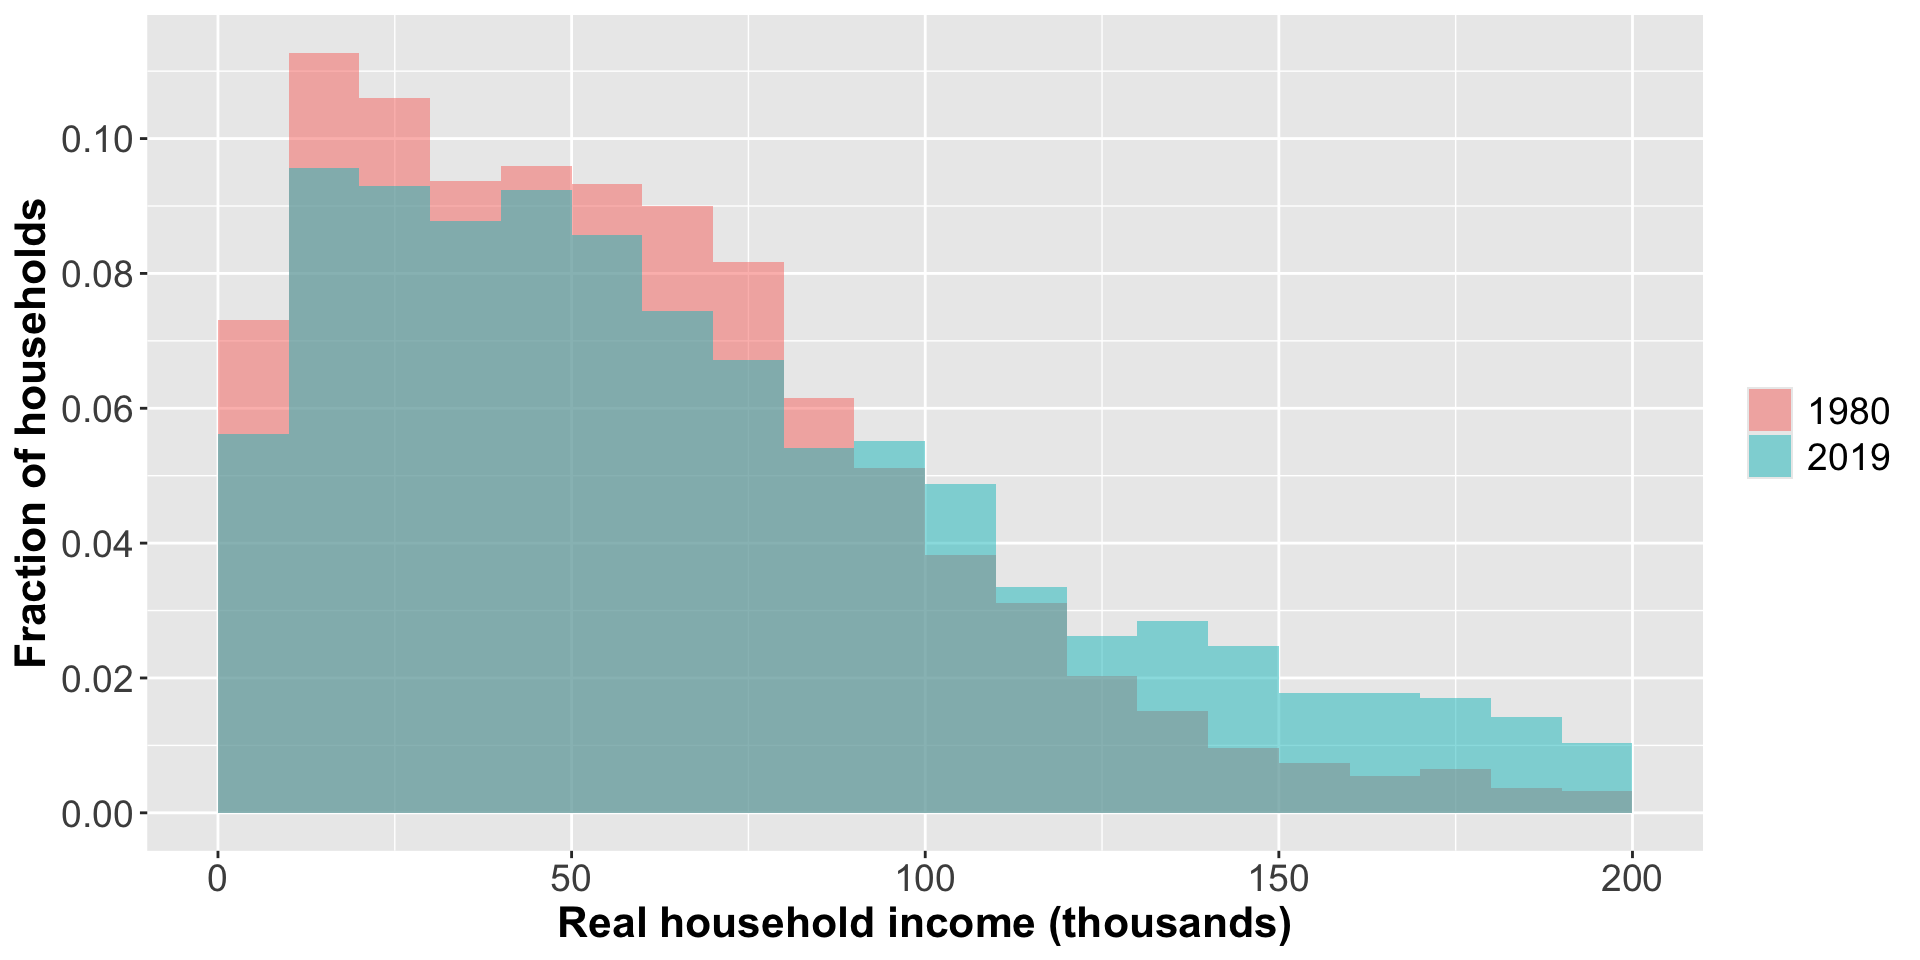
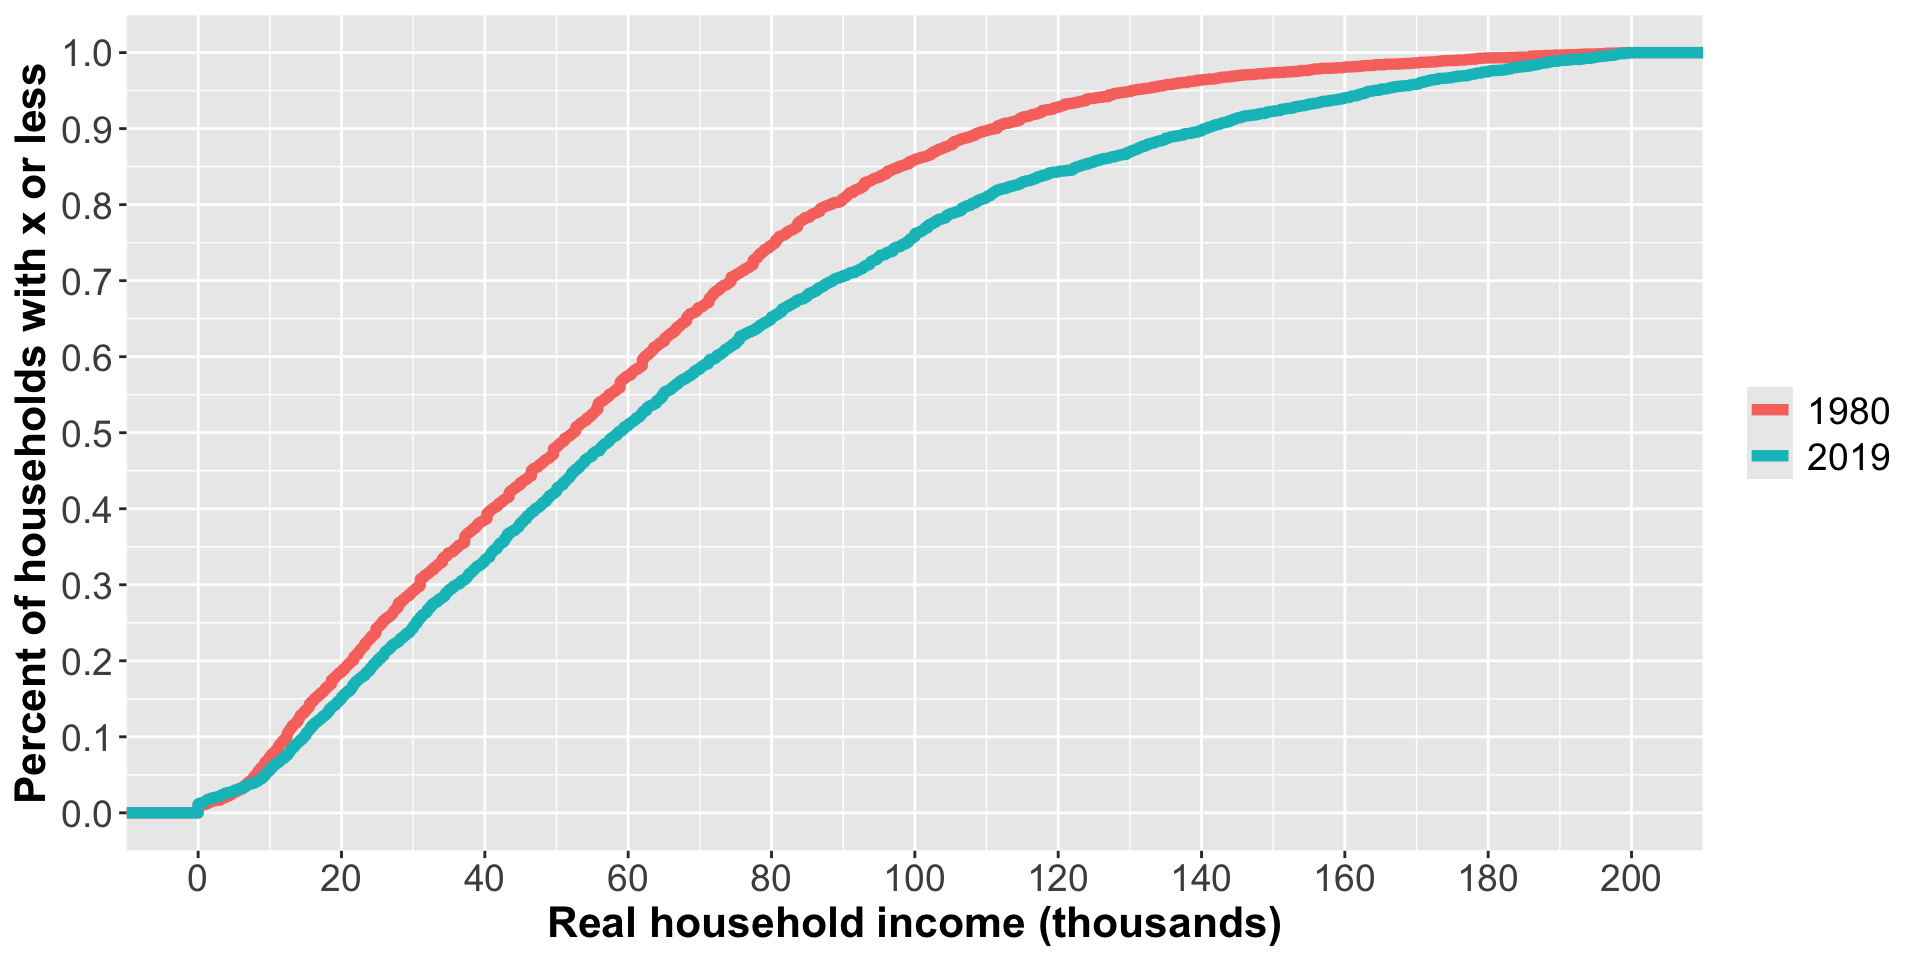
Distributions of real income

Introducing summary statistics

  • Typical values or “central tendency”
    • Mean
    • Median
  • Range and spread
    • Percentiles
    • Min, max
    • Variance
  • For categorical variables: [cross] tabulation

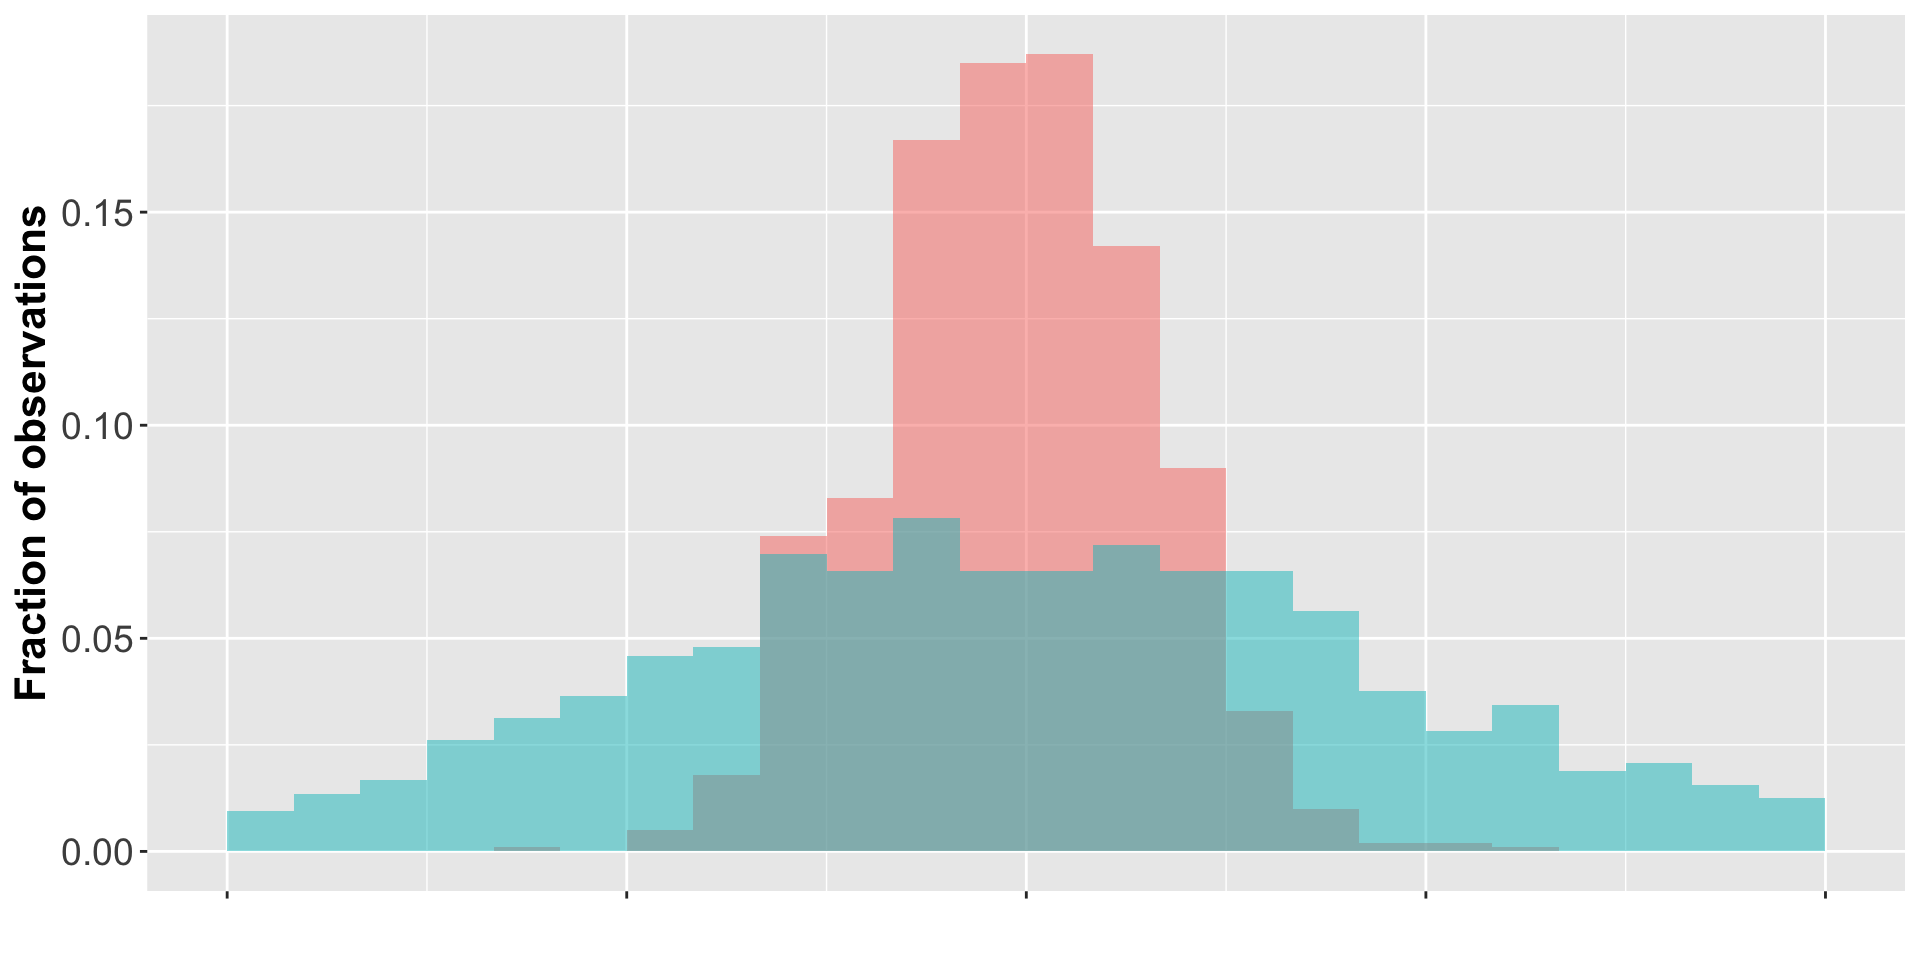
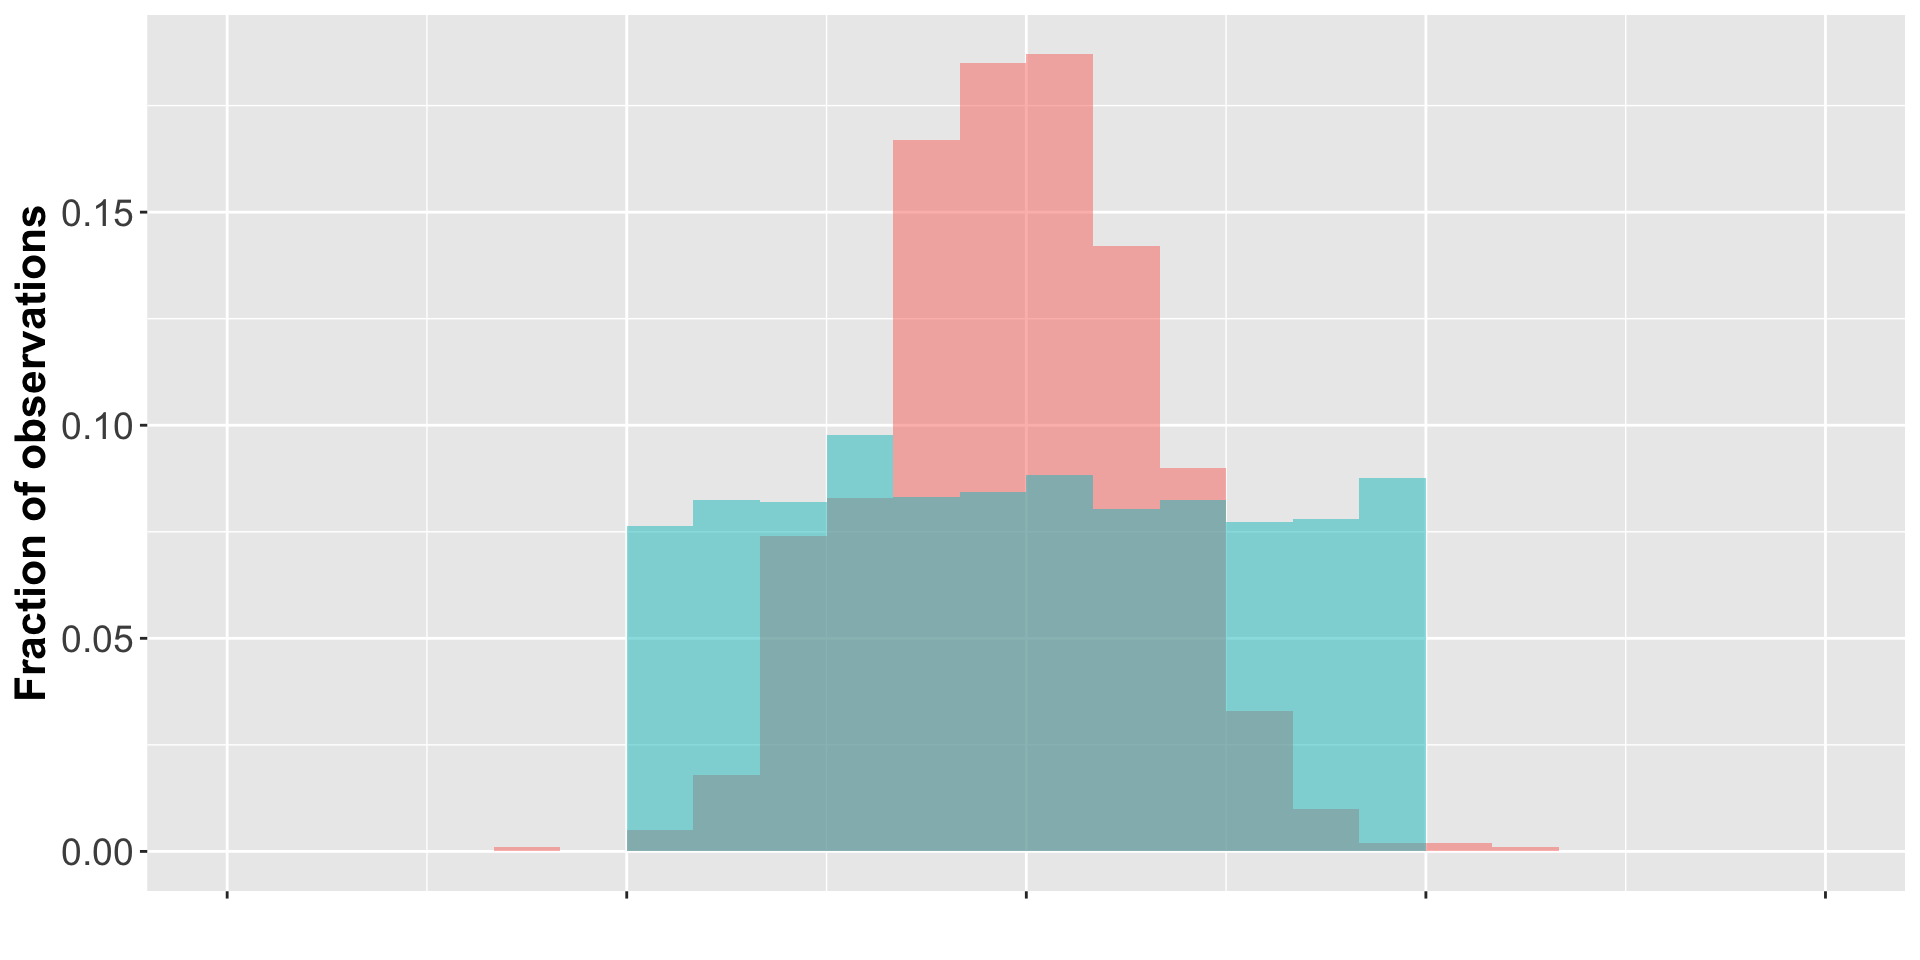
Central tendency and spread

Central tendency and spread
Income growth in the US
Our tools

  • Documentation / codebook
  • Frequency tables
    • The less exciting version of a histogram
    • Combining group_by(), summarize(), and n()
  • Quantiles or percentiles
    • Definition
    • quantile() function
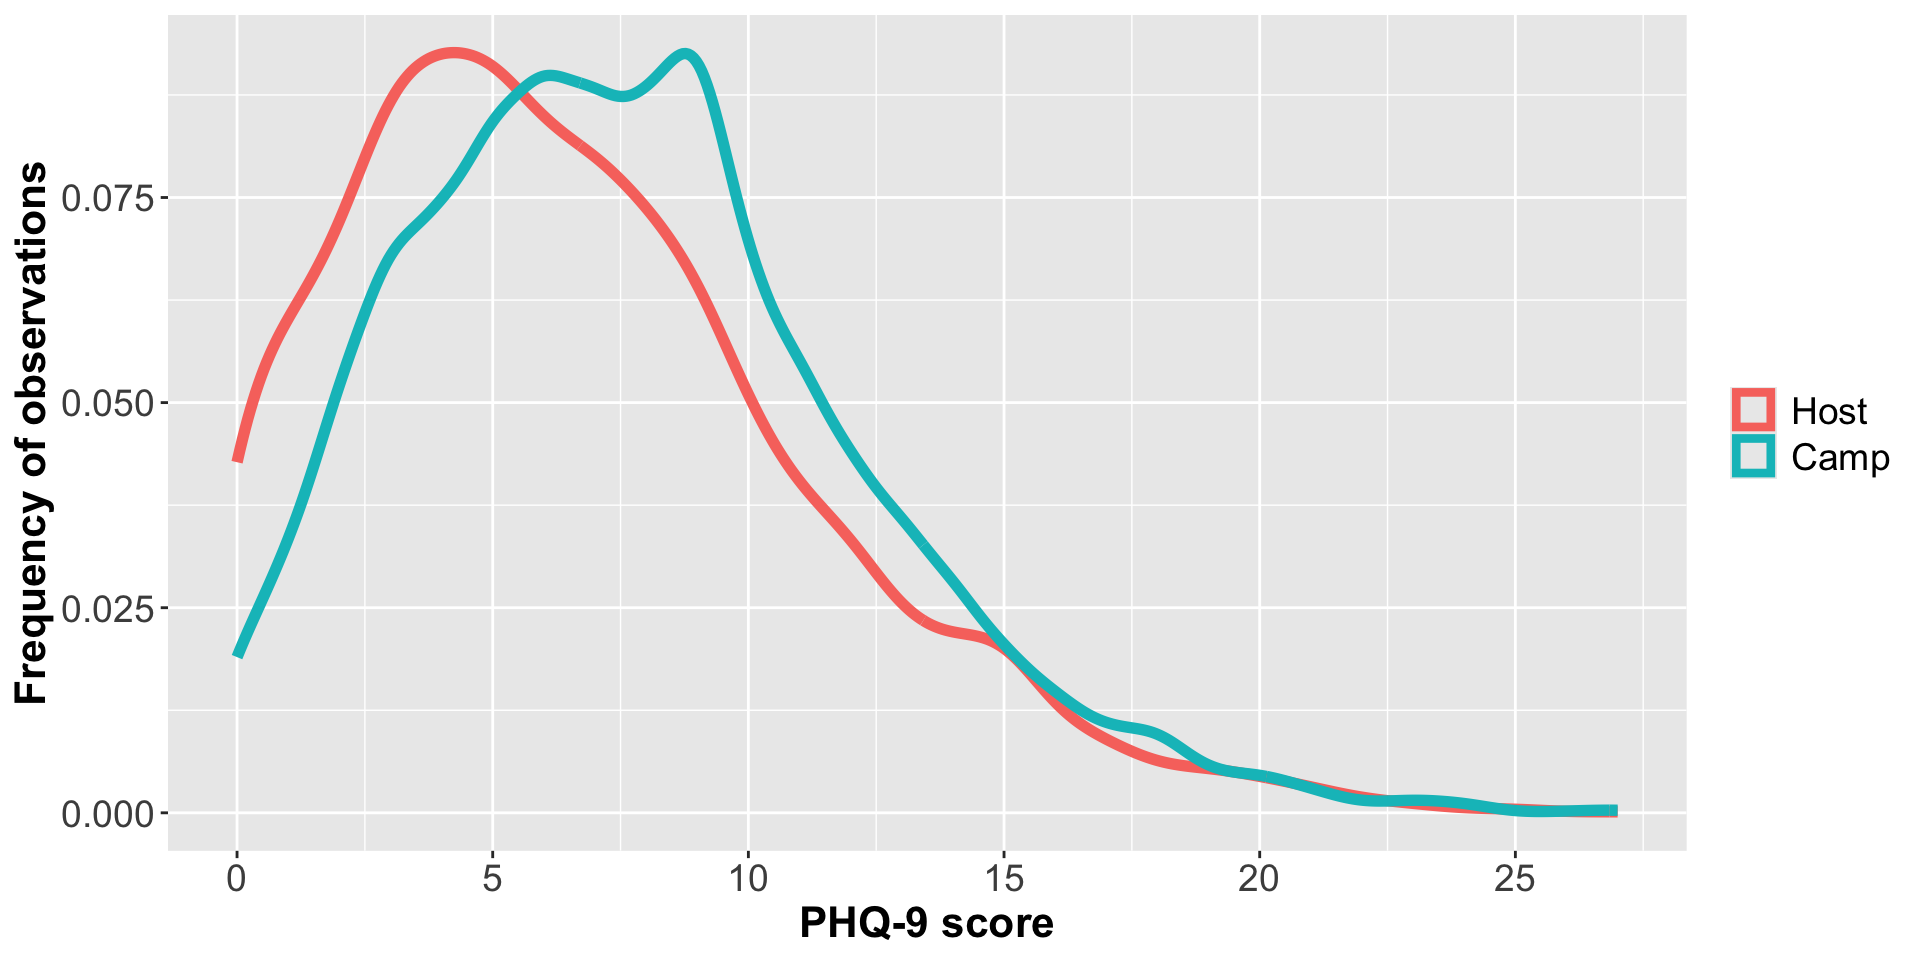
    # Mental health in a refugee setting

Density of PHQ-9 scores by community

Our tools

  • Documentation
    • Questionnaire
    • Basic information document
  • Creating new [binary] variables
    • mutate()
    • ifelse()

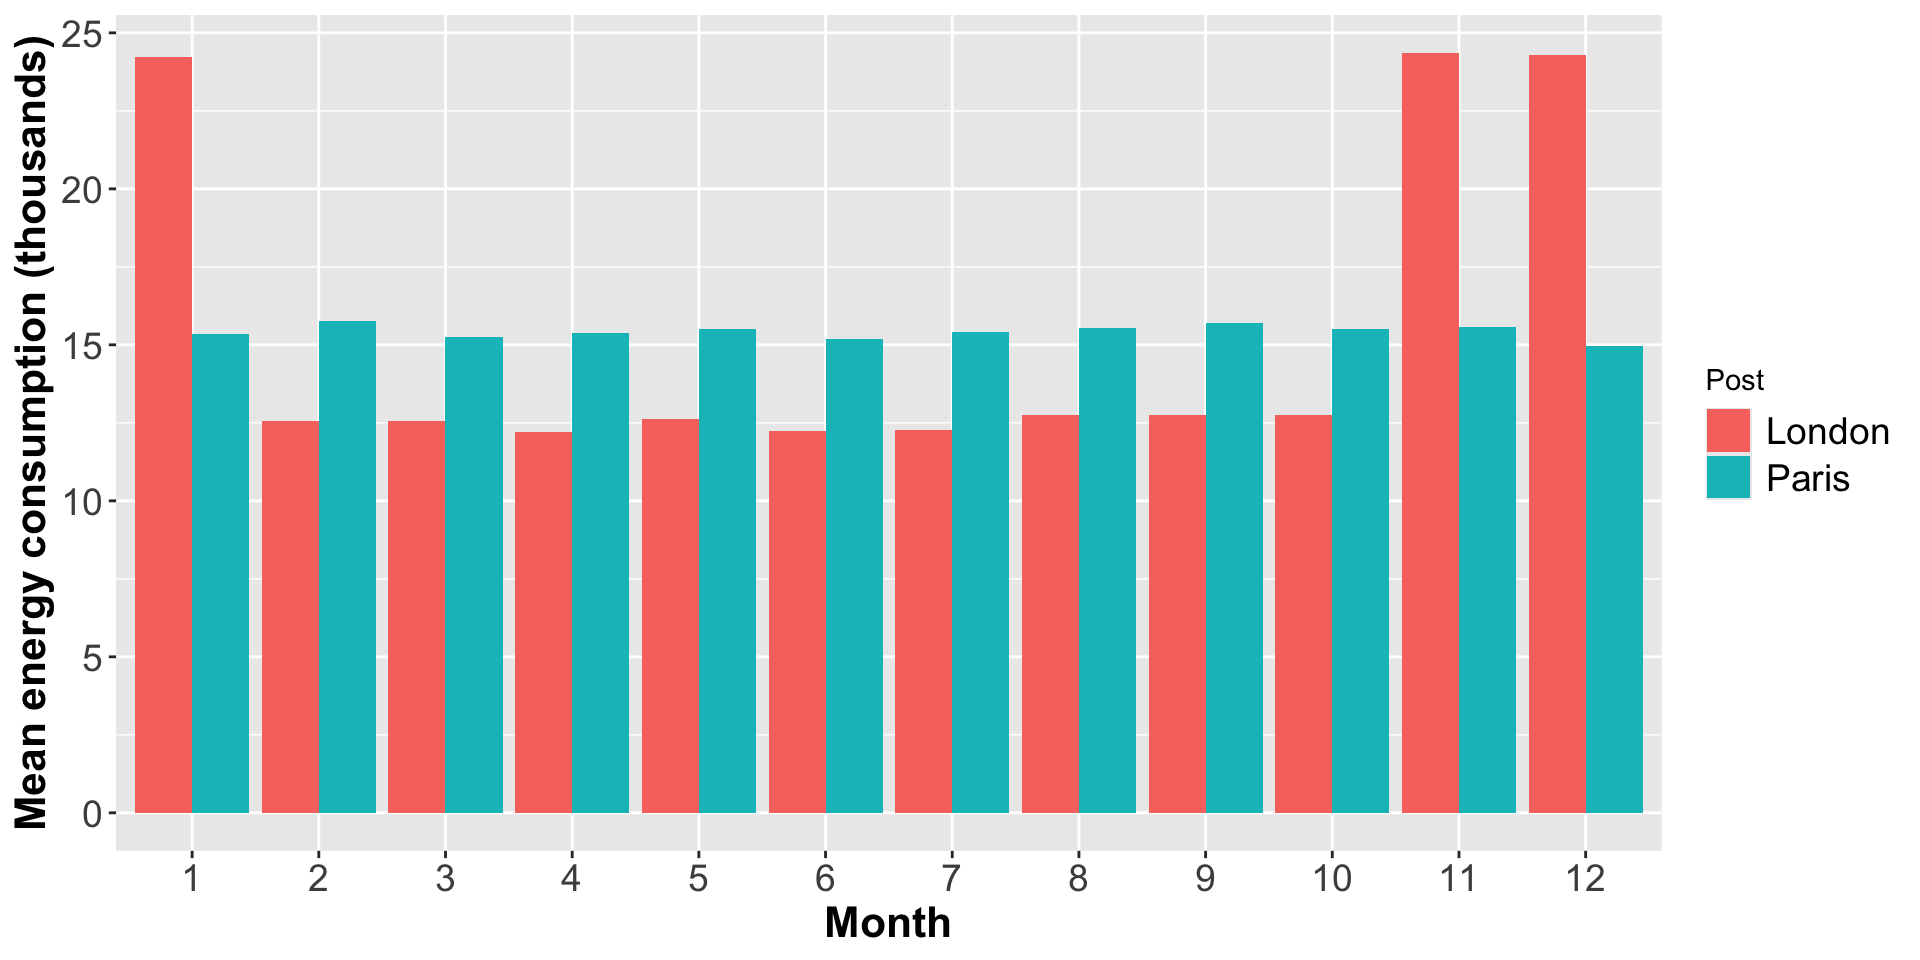
Energy use at US Embassies

Simulated energy use by month

Our tools

  • Measuring the extremes
    • min()
    • max()
  • Variance
    • Definition
    • var()

Preview of next time

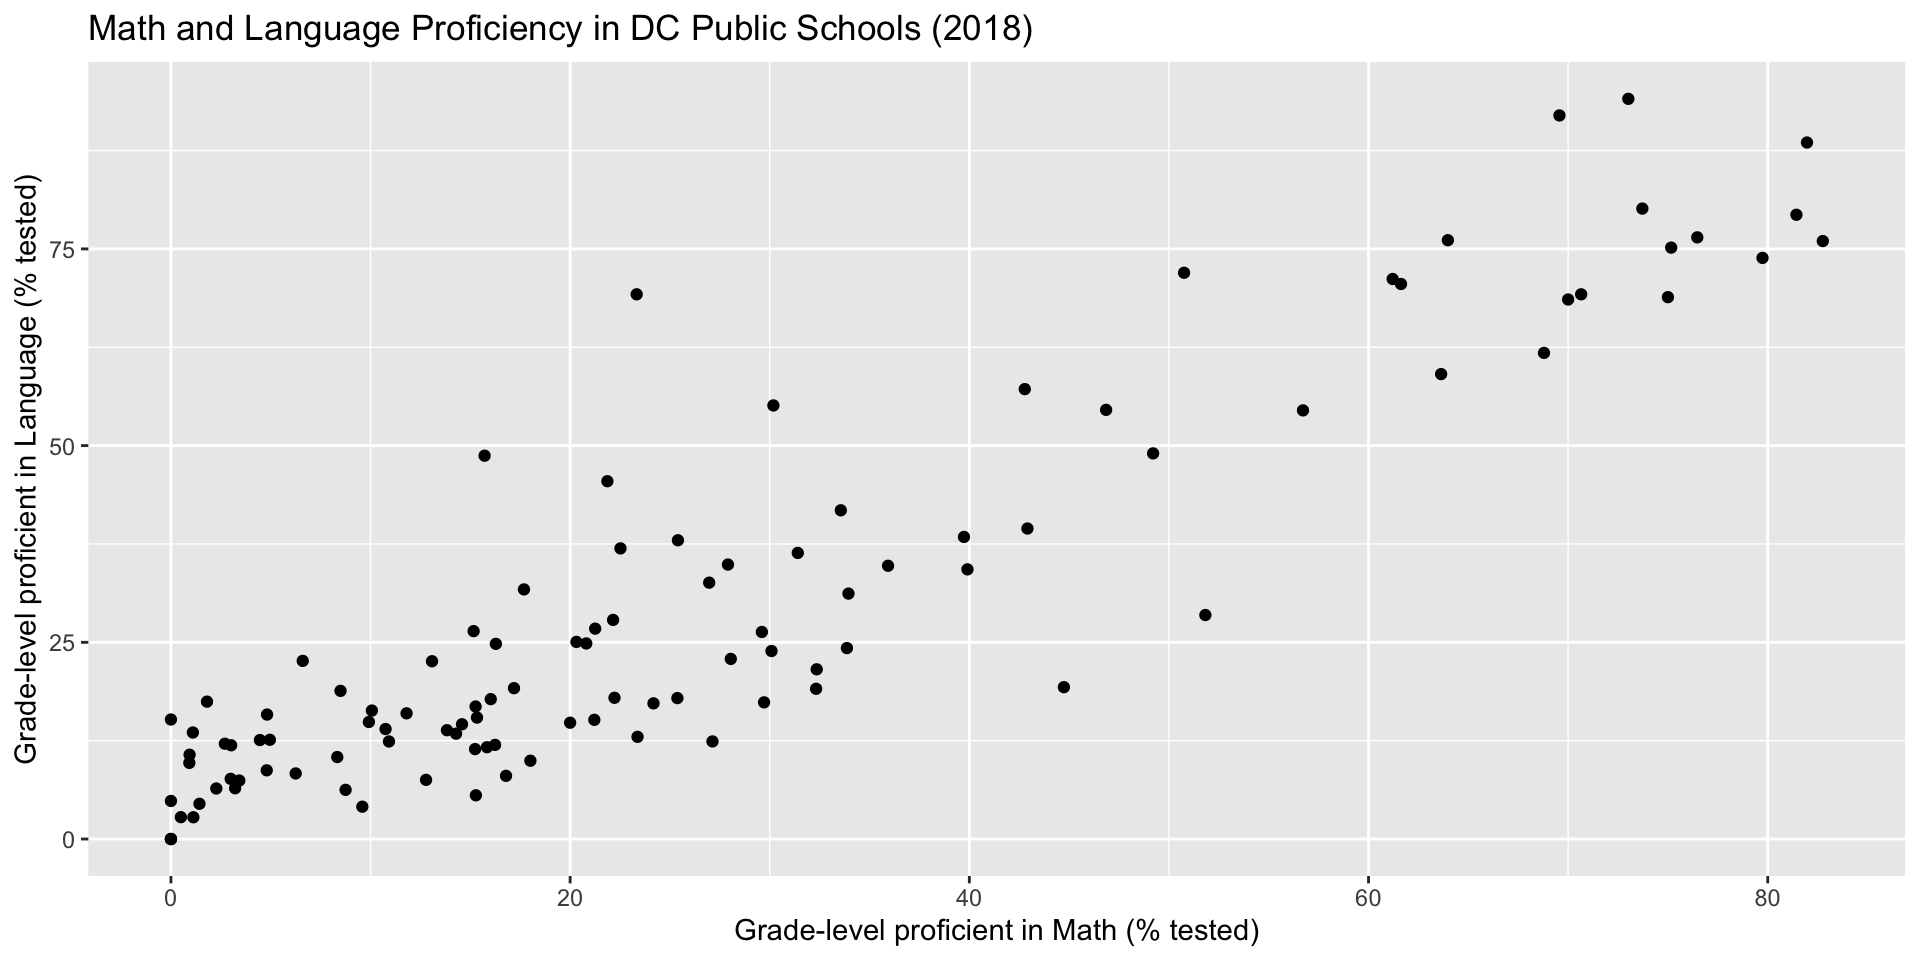
Relationships between variables

Questions to ponder

How could you draw a line to summarize the relationship between math and language scores?