Week 02 - What can we learn from visualizing distributions?

Prof. C. Austin Davis

Spring 2025

Roadmap for today

  • Syllabus quiz
  • Review math assessment
  • A look back at last week
  • Visualizing and understanding distributions
    • Histogram / frequency distribution
    • Density
    • Cumulative distribution
  • Preview of next time

Syllabus quiz

Math assessment*

A look back at last week

  • What is data? Unit of analysis? Variable?
  • What types of variable will we encounter?
  • Translating between concepts and measurement
  • Console vs. source pane
  • Our first R script

What can we learn from visualizing distributions?

Synthesizing large quantities of information to establish general, actionable facts about the world

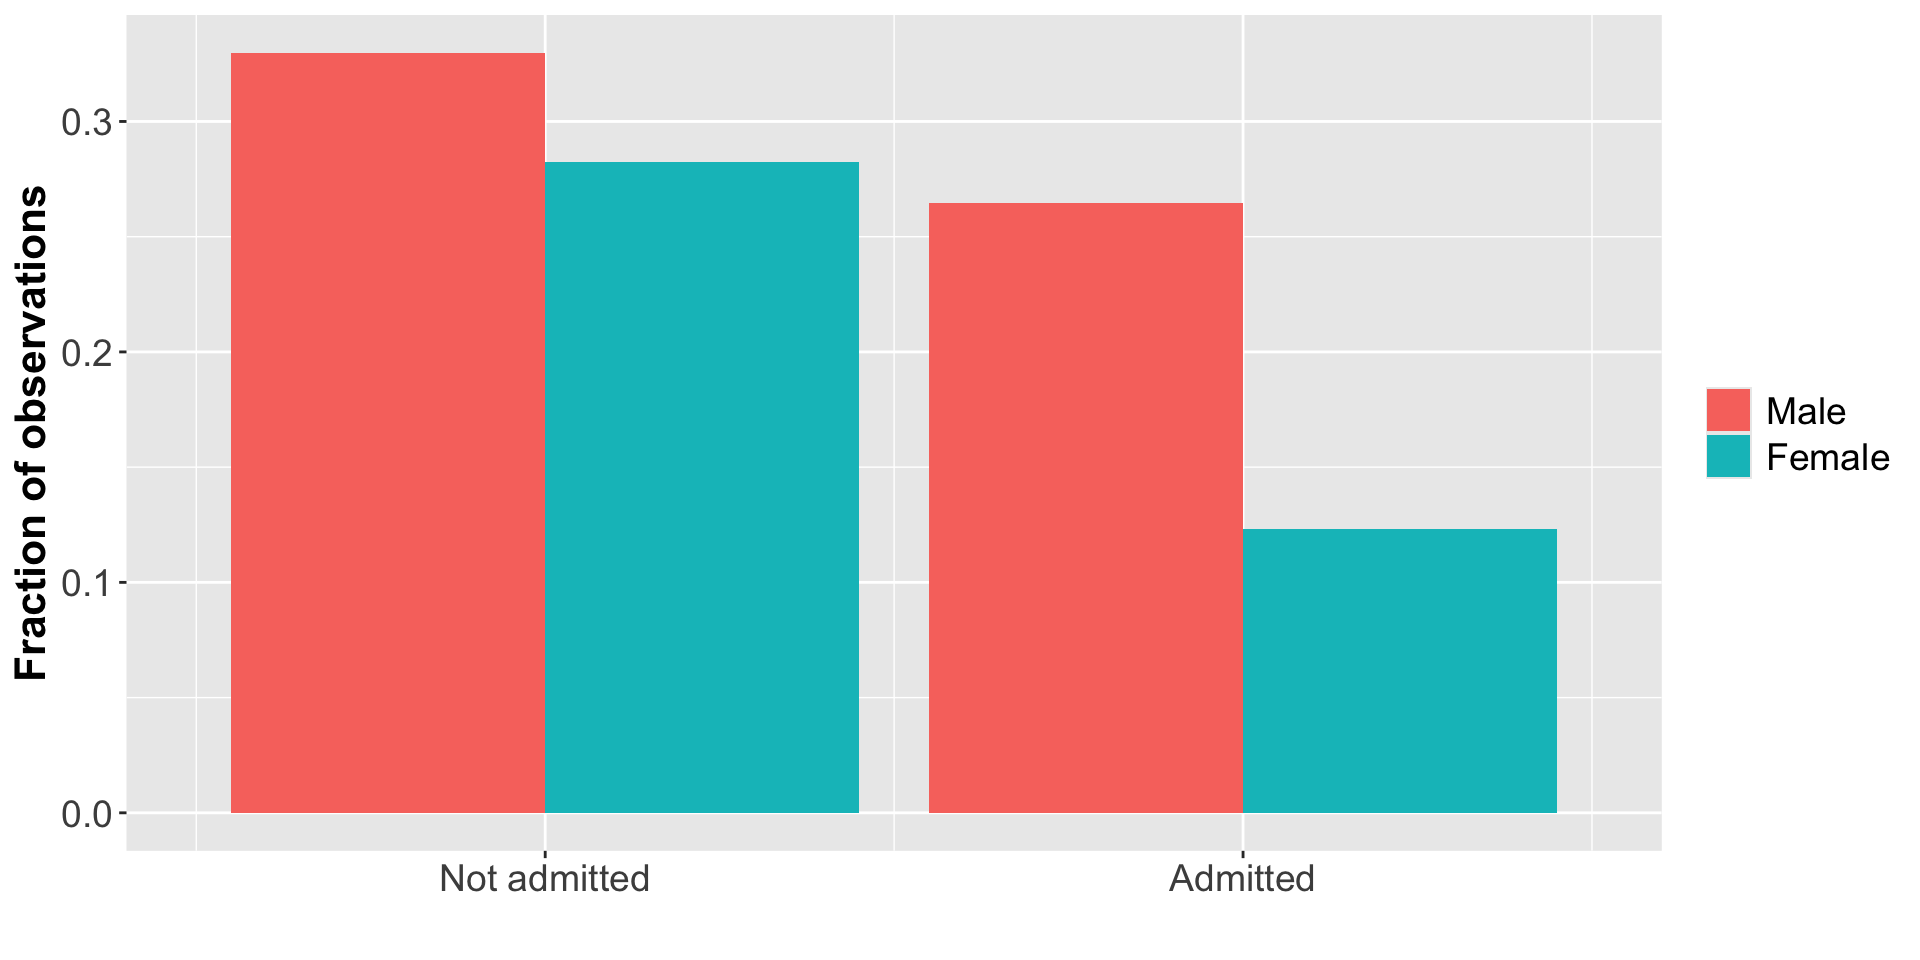
UCB Admissions by Gender*

Tools we’ll need*

  • Reading in data: read_dta() and read_csv()
  • Inspecting data: tibbles, summary(), and View()
  • Picking observations: filter() and the pipe operator %>%
  • Plotting: ggplot(), geom_bar(), geom_histogram(), geom_density()

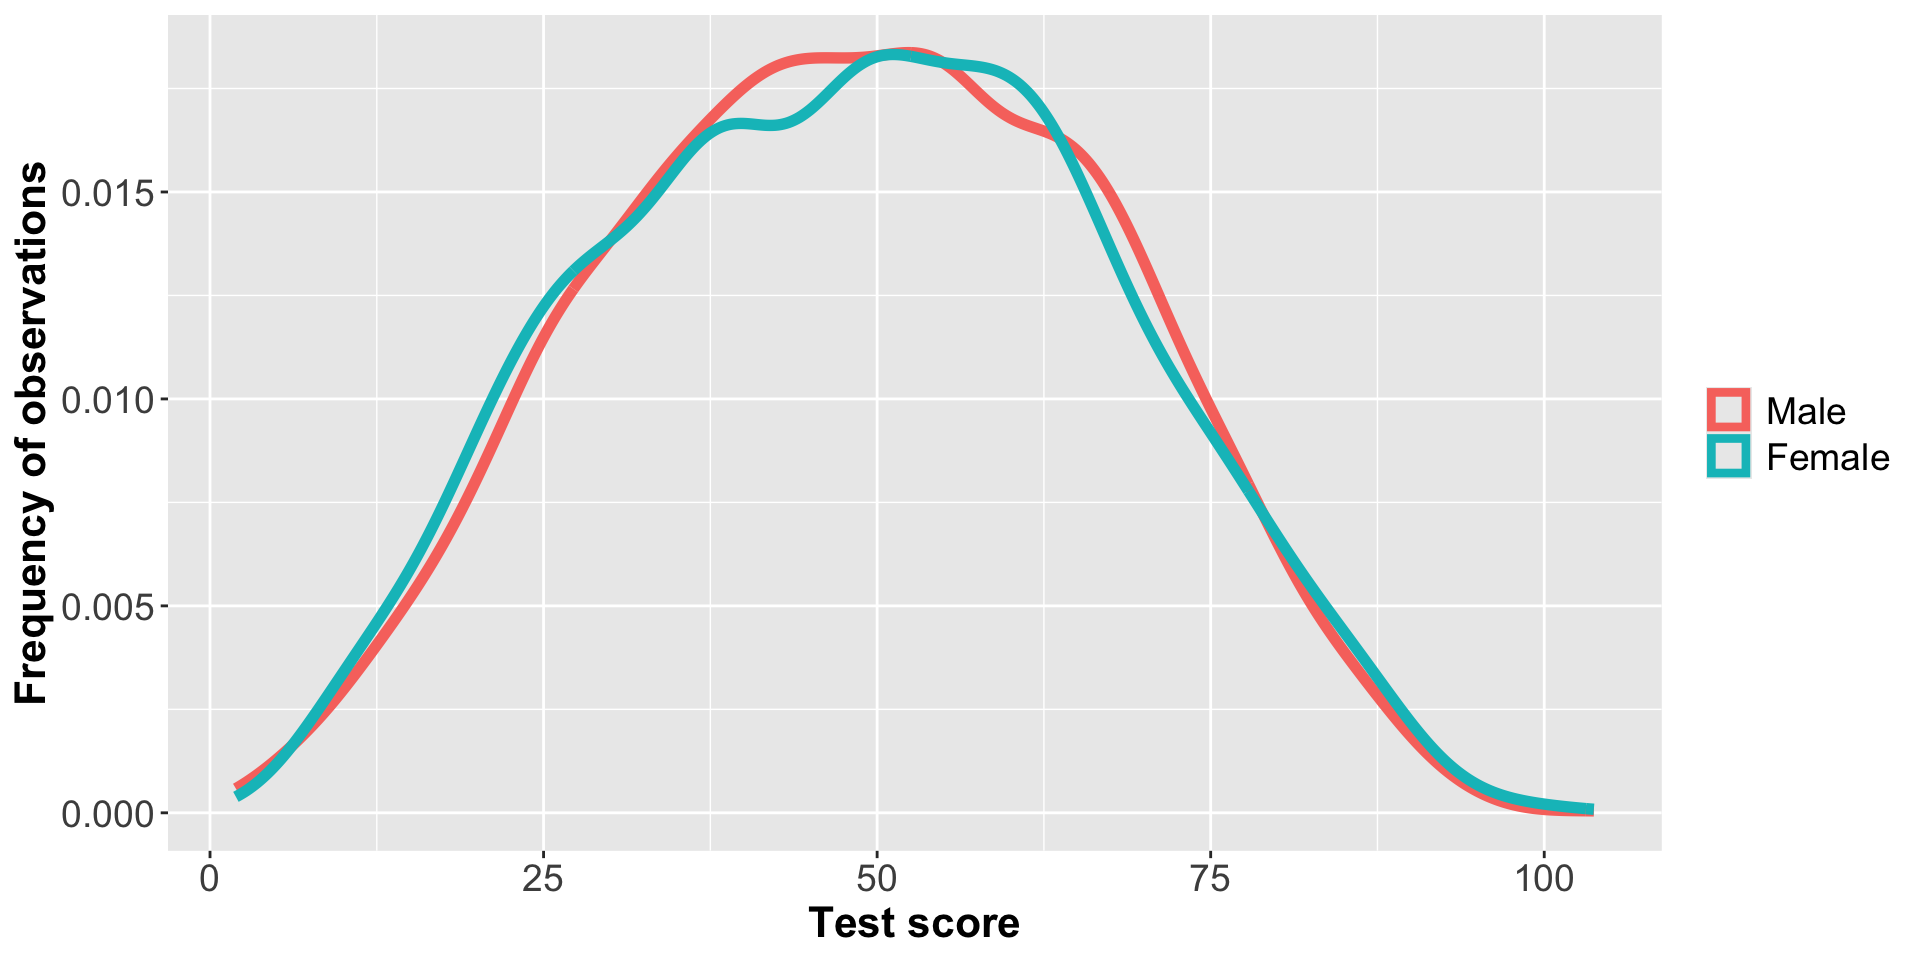
UCB Applicant Test Scores by Gender*

Intermission

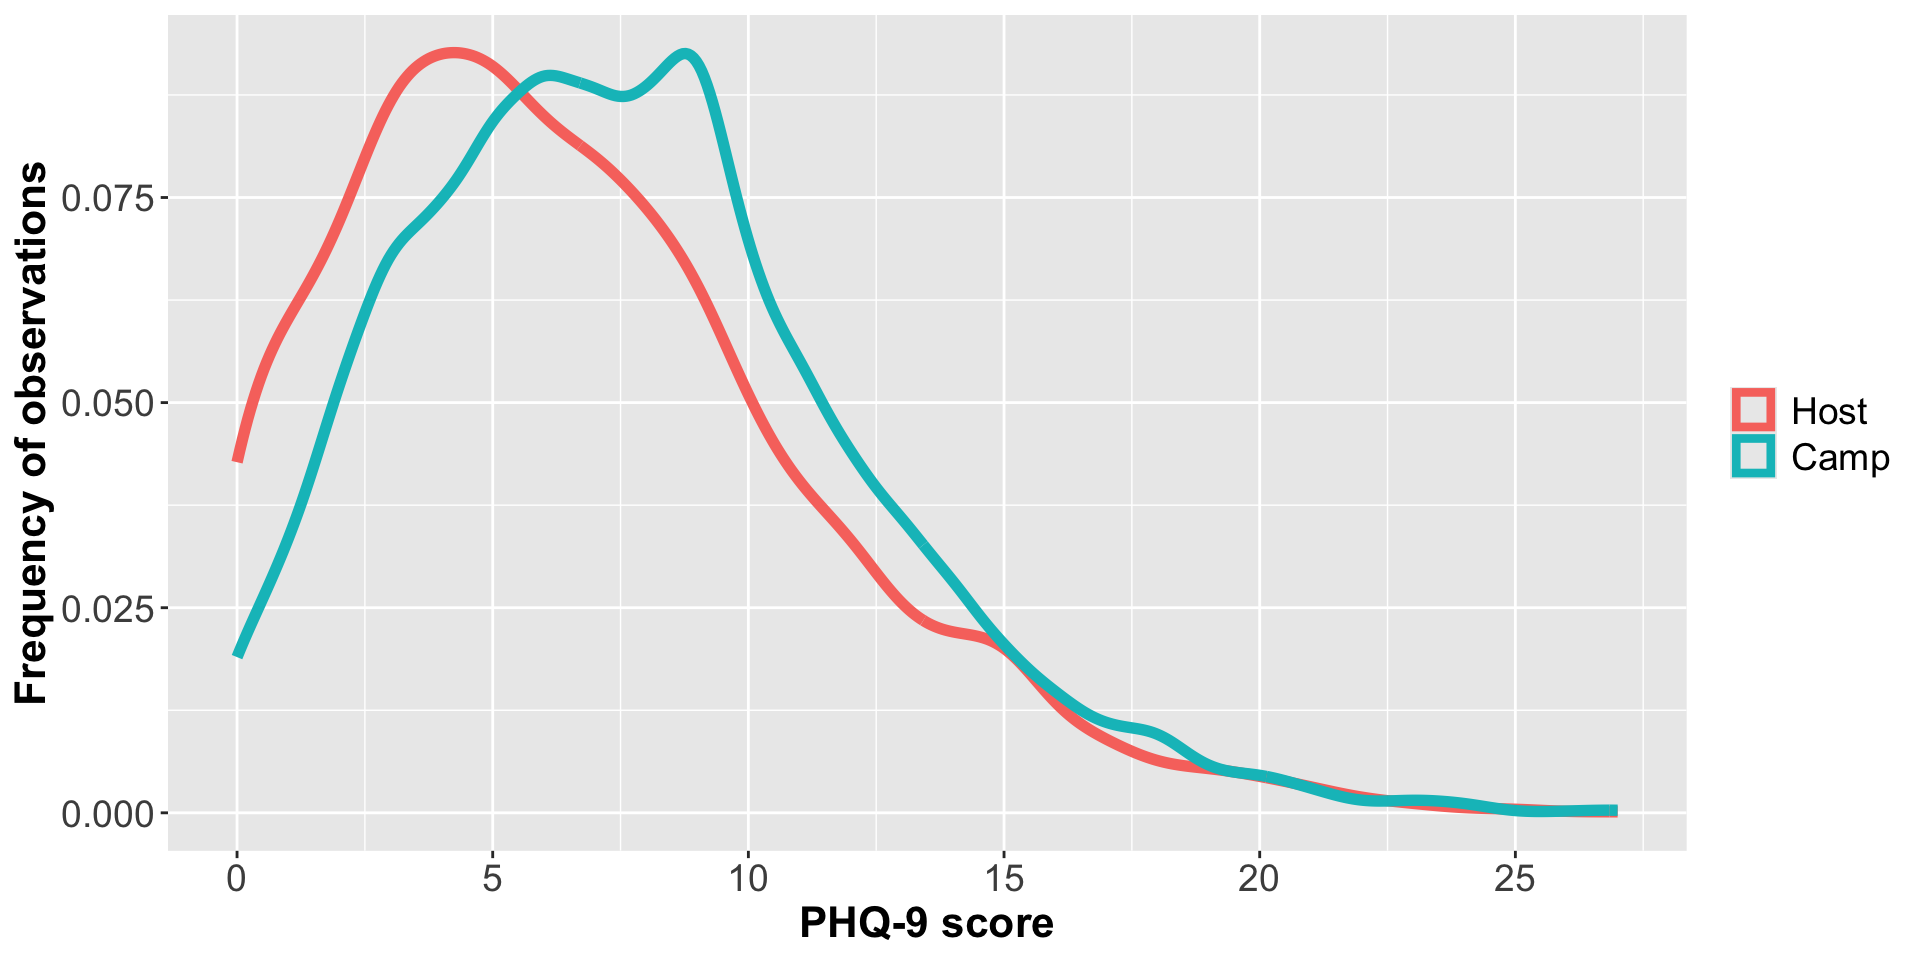
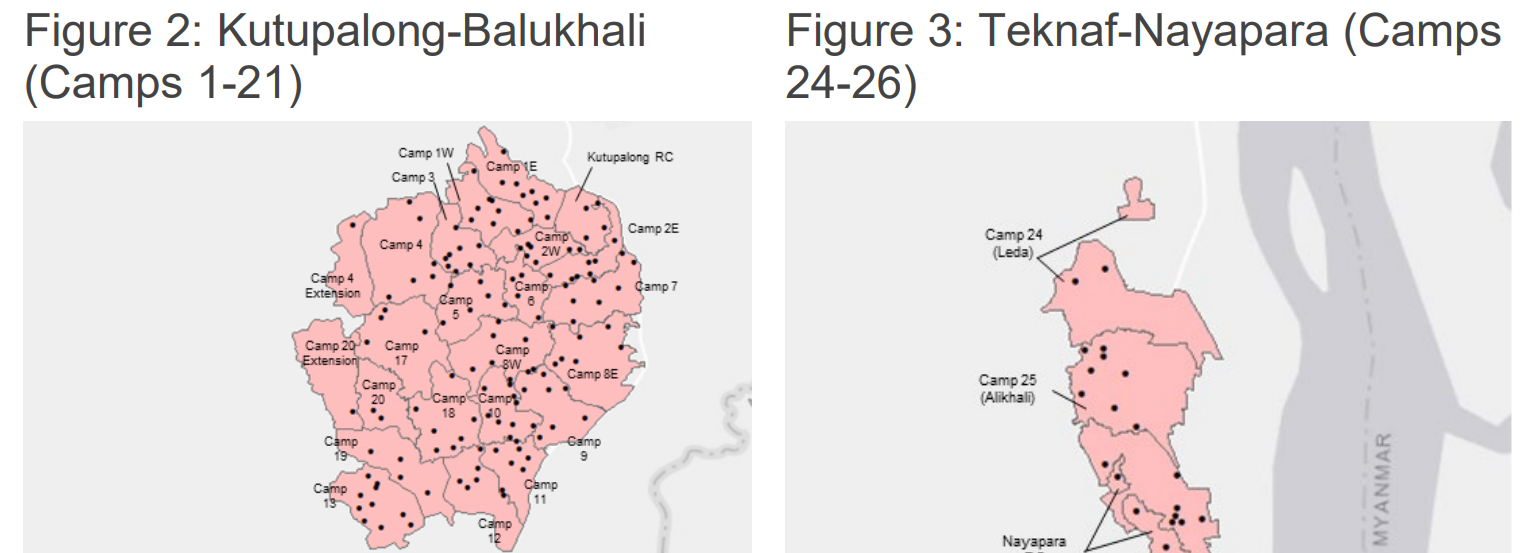
Mental health in a refugee setting*

Understanding your data*

Codebooks / questionnaires

Other documentation

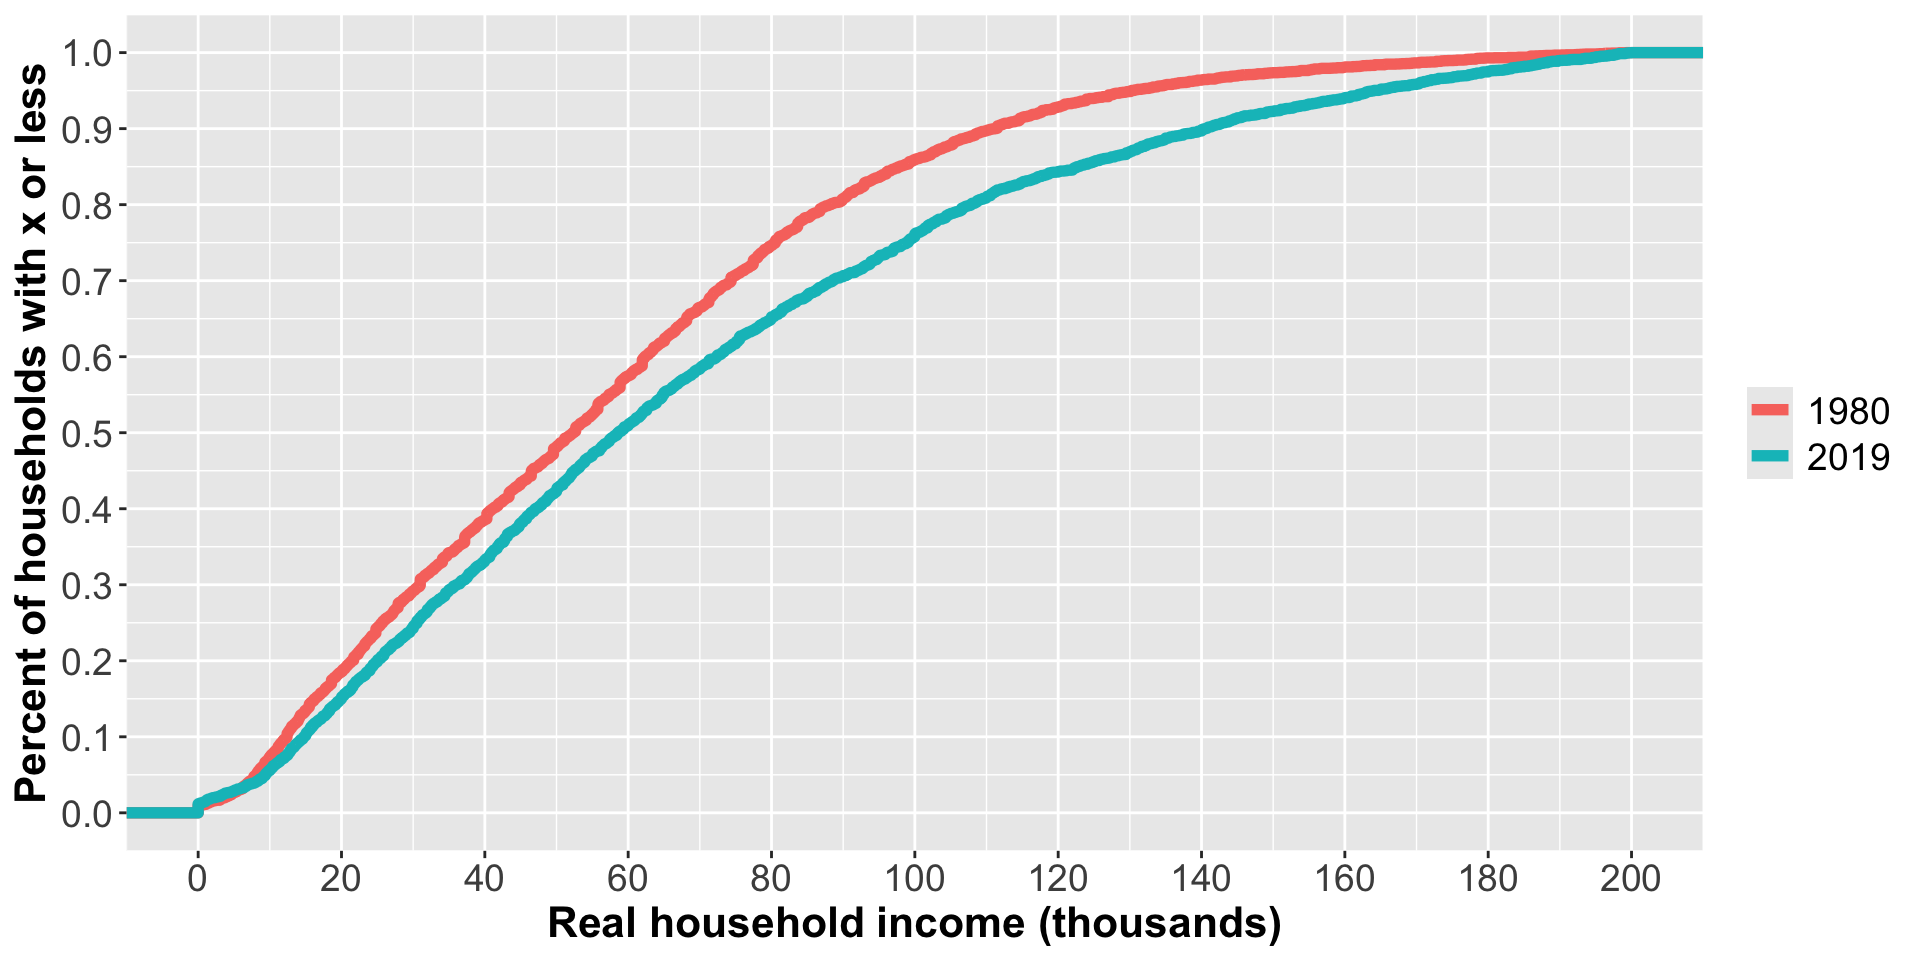
Income growth in the US*

Preview of next time

From pictures to numbers: rank statistics, mean, variance, and the tidyverse syntax.

Questions to ponder

  • How could you tell if an embassy was using too much electricity?
  • What statistical tool could help you measure income inequality?