| Assignment | Due date | Weight (pct) |
|---|---|---|
| In-class exercises (7) | See Syllabus / Canvas | 10 |
| At-home problems (5) | See Syllabus / Canvas | 30 |
| Project planning worksheet | Mon Mar 2 / Tue Feb 24 | 5 |
| Midterm exam | Mon Mar 23 / Tue Mar 17 | 20 |
| Project presentation | Mon Apr 13 / Tue Apr 7 | 10 |
| Project final paper | Mon May 4 / Tue May 5 | 25 |
Week 01 - Intro
Prof. C. Austin Davis
Spring 2026
Introductions
Welcome! Roadmap for today
- Introductions
- Syllabus and what to expect
- What is data
- Intro to R
- Preview of next time
Introductions
- What is your name?
- What is your quest?
- A mundane little quirk OR a hobby you’ll never quit
A little more about me

A little more about me
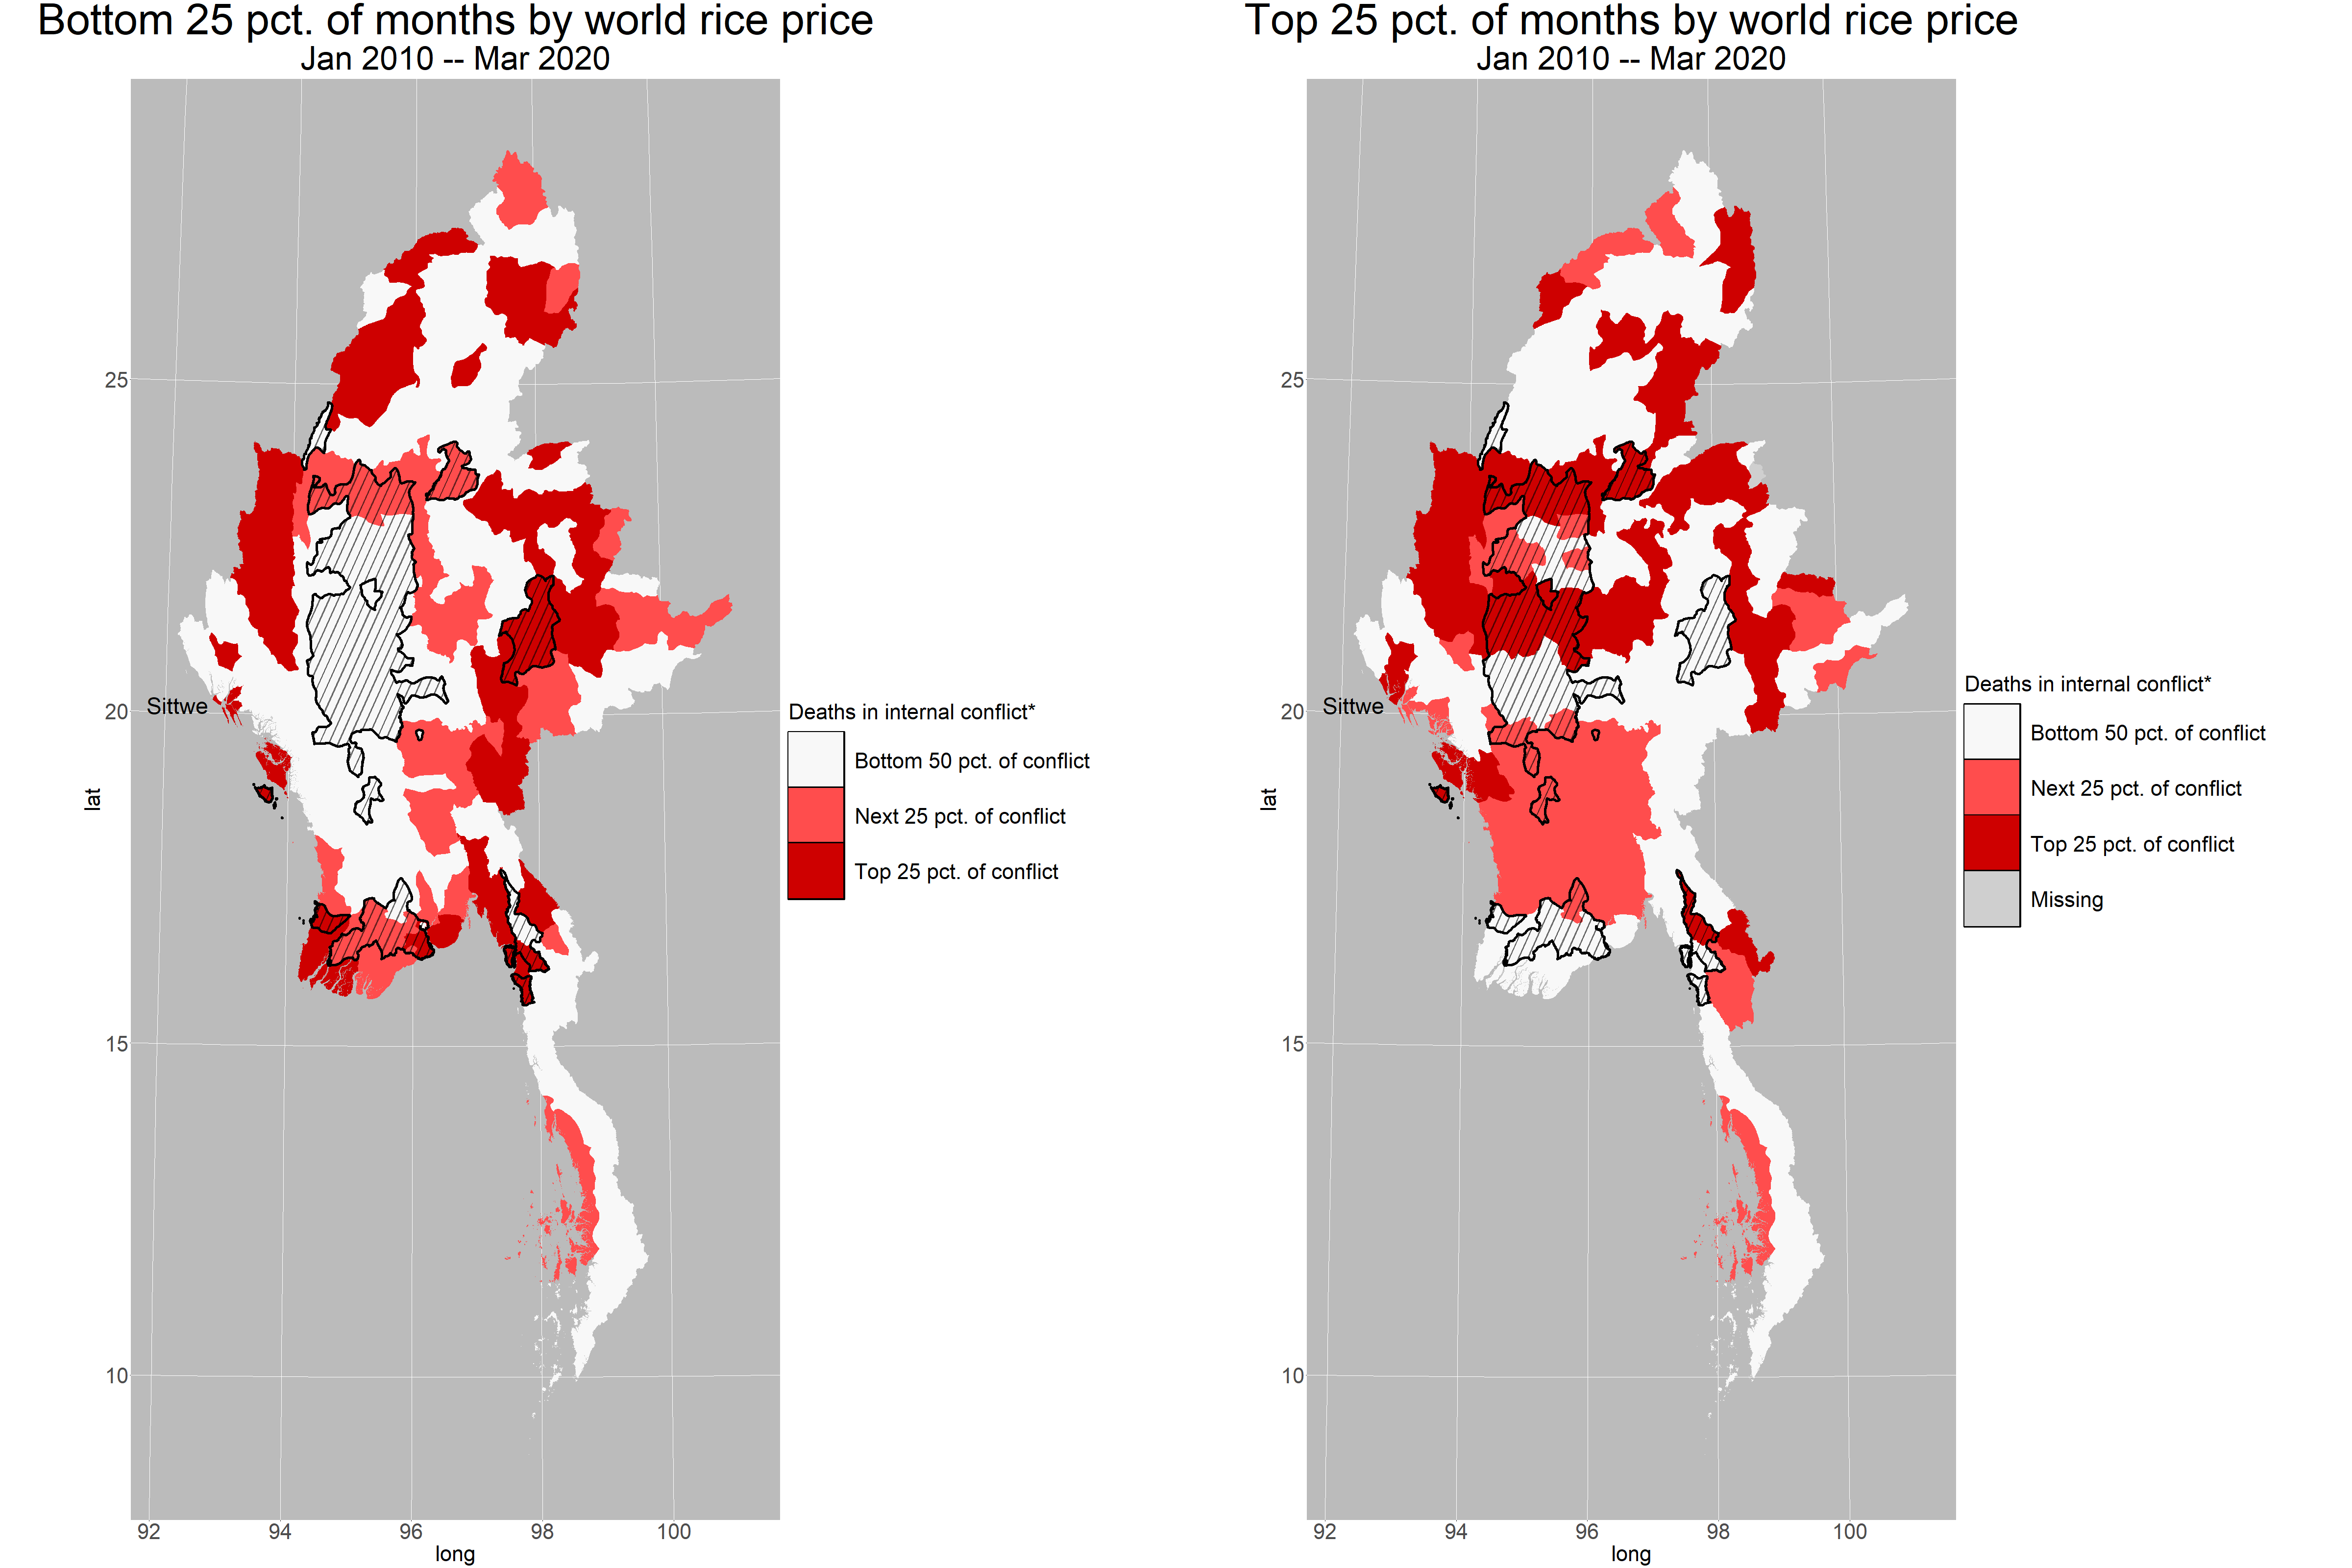
A little more about me

A little more about me

Syllabus
Why are we here? Learning objectives:
- translating important questions into quantitative frameworks,
- selecting and conducting appropriate methods of quantitative analysis,
- drawing substantive insights from your quantitative analysis, and
- communicating your methods and conclusions so that others can understand and interrogate your quantitative reasoning
What will we learn?
Descriptive statistics
How can we synthesize large quantities of information to establish general, actionable facts about the word?
Regression
What is the nature of relationships between key measures of environments, behavior, or well-being?
What will we learn?
Inference
Do these facts or relationships generalize?
Causality
How can we identify causal relationships in data?
Why R is our primary tool
- Free and open source
- Powerful but approachable
- Makes it easy to share and reproduce results
Why R is our primary tool
Job relevant
- “Many positions I’ve been applying for request quantitative research experience and frequently request specific experience with R …”
- “There is a sentiment among students that [SIS 600] required too much coding that ‘they will never use this in the real world’ … Not only have I seen evidence to the contrary in my short time since graduation, but I have also come to understand that R is a far more powerful tool than I had previously understood as a student.”
Our guides
[Text]book chapters
- Wheelan Naked Statistics
- Bueno de Mesquita and Fowler Thinking Clearly with Data
Our guides
Course-specific materials we provide
- SIS 600 R Survival Guide
- Problems and exercises with solutions
- Written feedback on presentation, paper
- Lecture outlines with code examples
Your notes are key learning materials from this class
How will I be evaluated?
Quizzes (7) (10 percent)
- First set (next meeting) covers syllabus
- Approx. three basic questions based on reading
- Nine of these with two drops no questions asked
- Anticipates material covered in same class
How will I be evaluated?
Homework (5) (30 percent)
- First set covers basic math skills
- Generally one or two multipart questions
- Reinforce material covered in prior class
Midterm exam (20 percent)
How will I be evaluated?
Project planning worksheet (individual) (5 percent)
- Structures basic elements of your project
- Opportunity for early feedback
Project presentation (individual) (10 percent)
- Present preliminary analysis
- Pitch to your classmates for group formation
Project final paper (group) (25 percent)
How will I be evaluated?
- Canvas is the authoritative source for due dates
Grading*
Assignnment grades
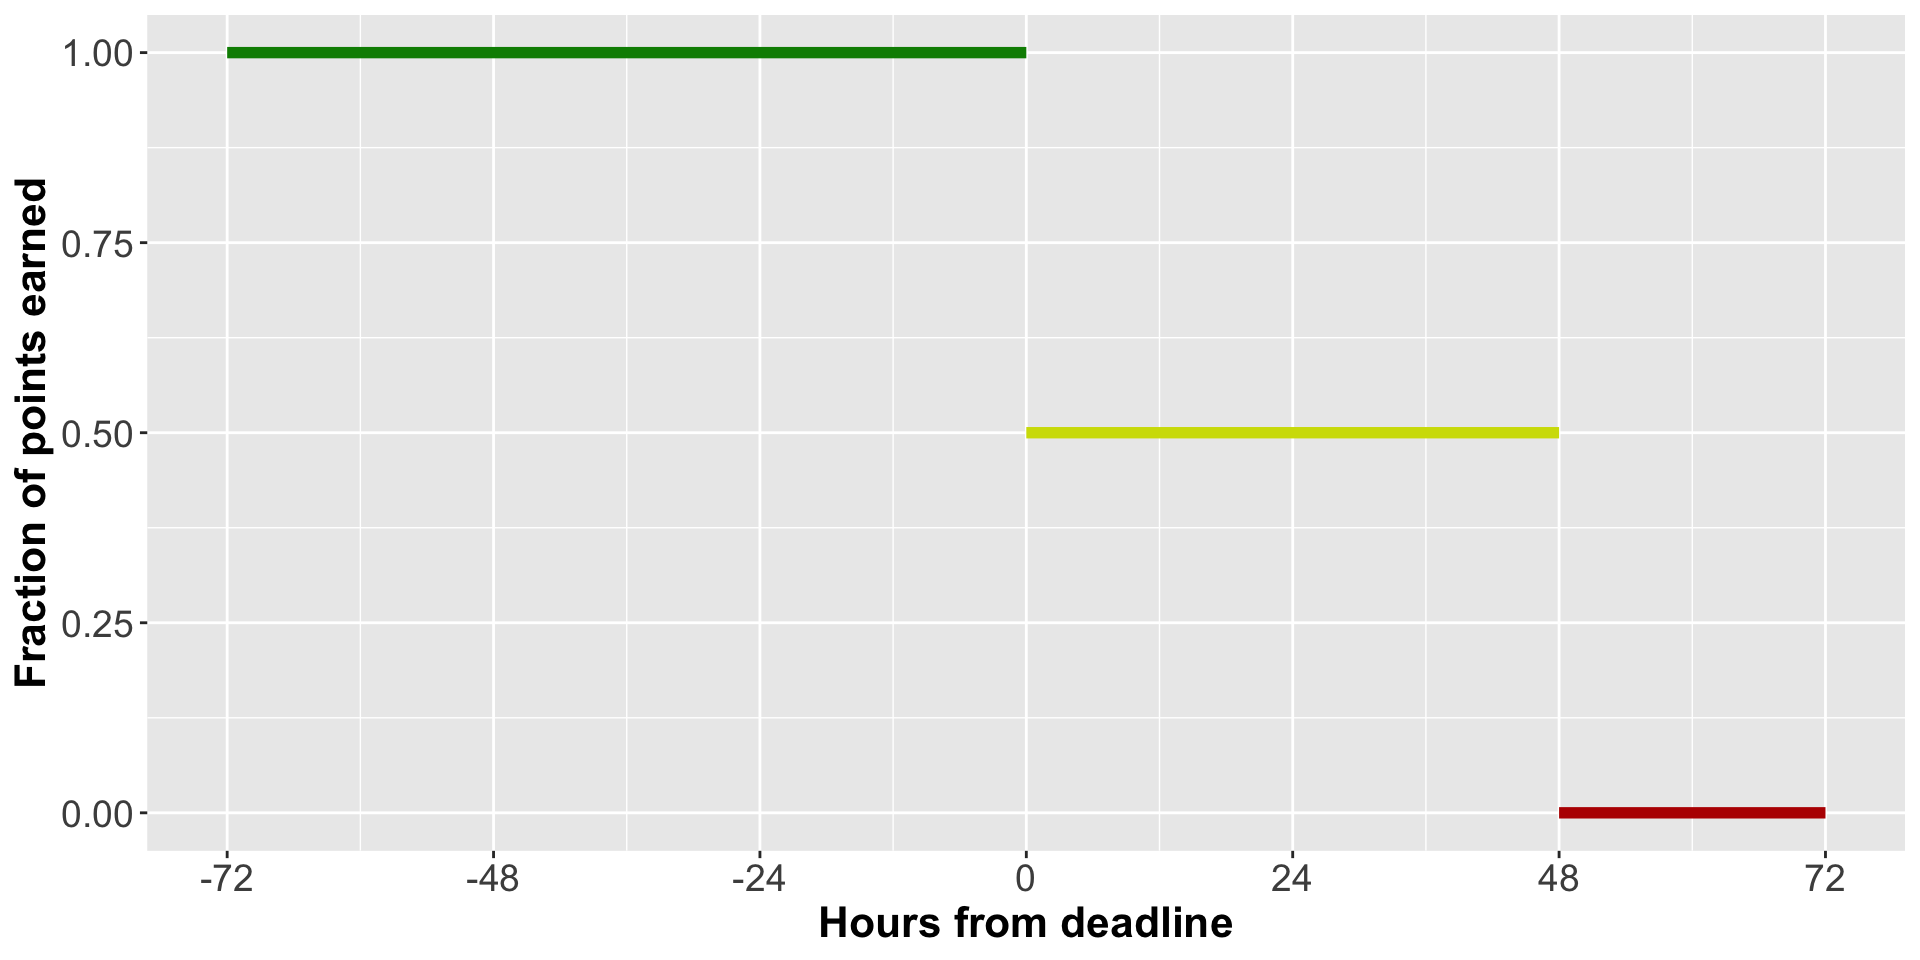
For quizzes, homework, and exams, each question (or part) will be worth one point and scored as follow:
- 1 point: a full and correct answer
- 0.5 points: any reasonable attempt, i.e. evidence of effort
- 0 points: no reasonable attempt, i.e. no evidence of effort
Course grades are curved
Attendance and evaluation
- I expect you to be here absent extenuating circumstances
- Quizzes, exam, presentation are all in class
- Quiz drops to account for absences
- If something serious comes up, contact me ASAP
Group work
- I encourage you to collaborate
- But all submissions must be original & individual
- OK: Discuss concepts, programming errors, results
- Not OK: sharing electronic files, copying and pasting
- Exception: group final project
- Any questions or concerns, ask me
AI tools like ChatGPT
- Things are moving fast
- Promise
- Annotated reference code
- Something between Google Searching and Office Hours
- Peril
- Can be inaccurate, incomplete, biased
- Rely on it so much you can’t tell when it leads you astray
AI tools like ChatGPT
- Policies and principles for this class
- You may use AI tools to assist with at-home problems, but must make good-faith effort first
- Anytime you use an AI tool, submit inputs and outputs from the tool as an appendix to the assignment
- You are responsible for the quality and integrity of your submissions
- Recommend you read output carefully
Late work*
How can you do well in this class?
- Be consistent and budget plenty of time
- Review feedback on graded work
- Ask for help
- cadavis@american.edu
- My office hours: M 10-11am; W 2-3pm; F 4-5pm
- Please use calendly
- TA: Pietro Zecca, OH TBD
- If needed, do more
Typical meeting
- In-class exercises + solutions
- Review at-home problem(s)
- Prof-led presentation / working examples
- Intermission
- Prof-led presentation / working examples
- Preview of coming week
Scheduling notes
- No class on Jan 19 (MLK)
- No class on Mar 9 / 10 (Spring Break)
Intermission
Randomness is everwhere
A process that can be repeated with different outcomes each time, i.e. the results are not perfectly predictable.
- Roll of a die, flip of a coin, draw of a card
- Gas prices, rainfall, vote totals
- SAT/GRE score, income, number of children
Our basic goals
- Assessing the likelihoods of various outcomes
- Uncovering systematic relationships
Our basic tools
- Probability theory
- Repeated, systematic measurement, i.e. data
- Statistical methods
Probability: characterizing uncertainty
Frequentist
Over a large number of repeated, identical trials, in what fraction of those trials would some event occur?
Bayesian
Given all the available evidence, what is a reasonable expectation about the likelihood some event will occur or some hypothesis is true?
Shared conceptualization and basic properties
Probabilities range from zero to one inclusive
- Probability of zero (\(p(A)=0\)) means the event is impossible
- Probability of one (\(p(A)=1\)) means it is certain, or
- it is possible but not certain (\(0 < p(A) < 1\)).
Concrete examples*
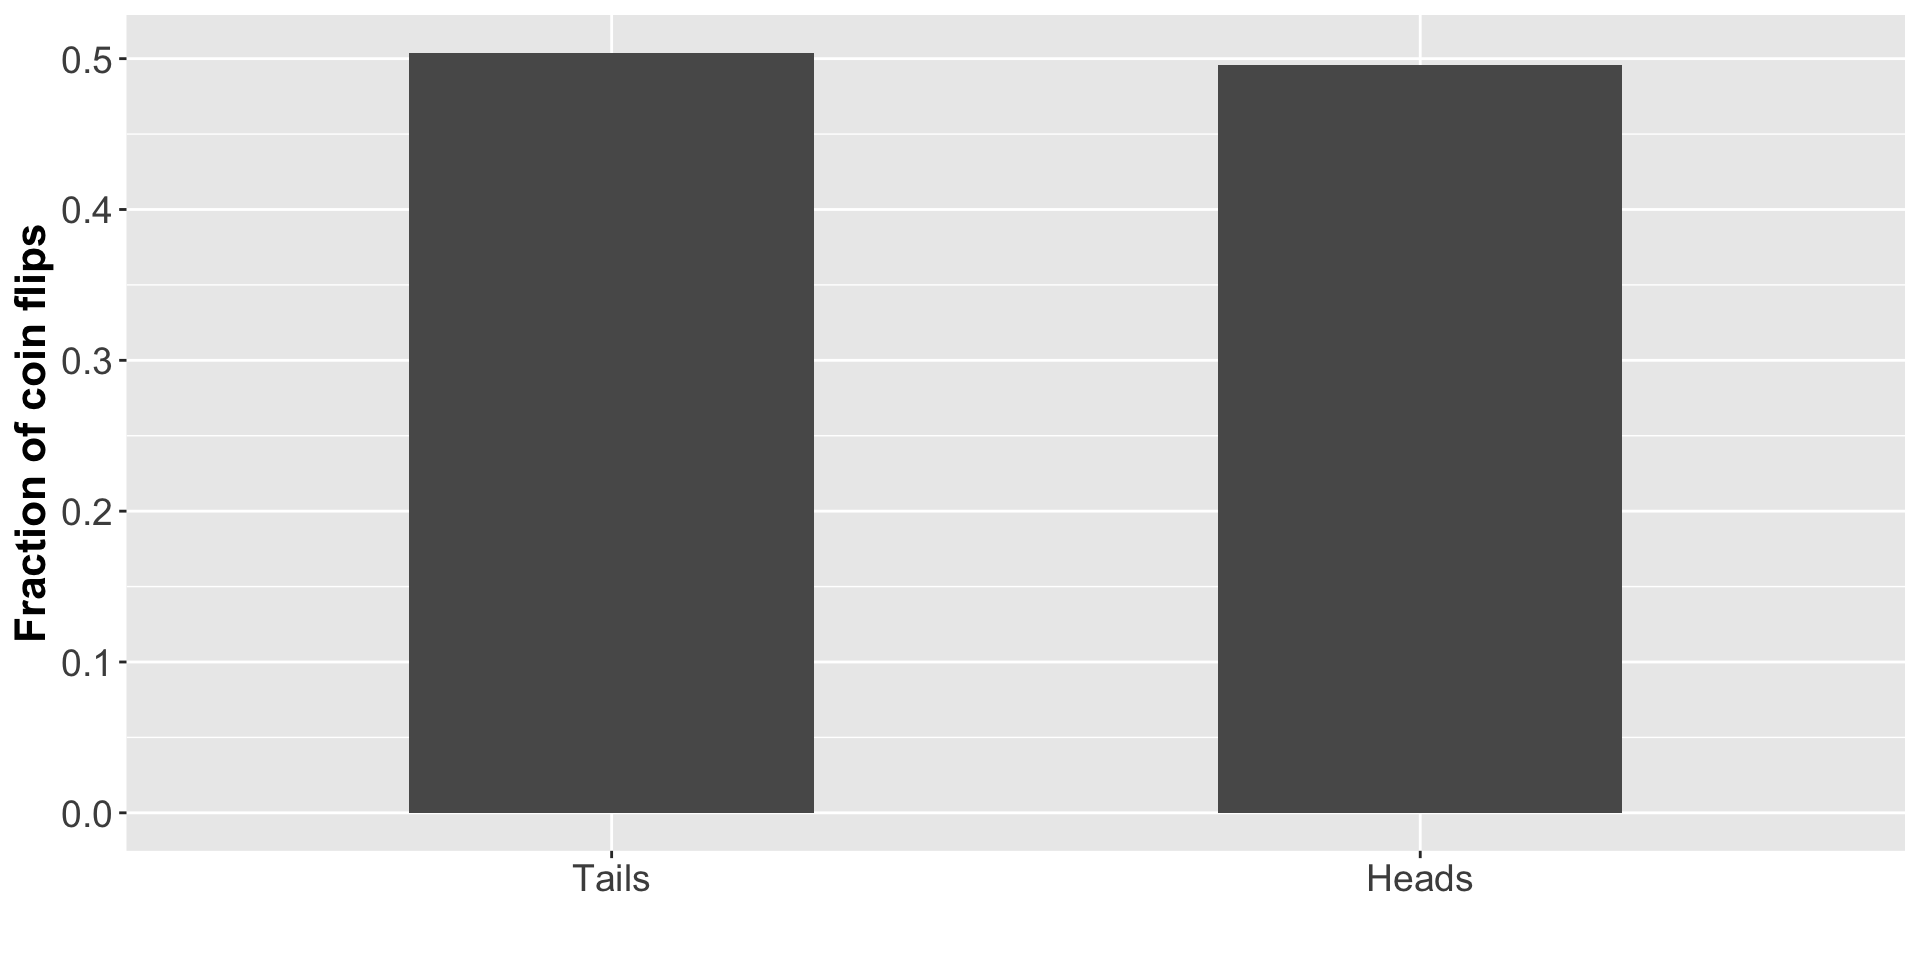
- \(p(\text{Heads})\) for a fair coin?
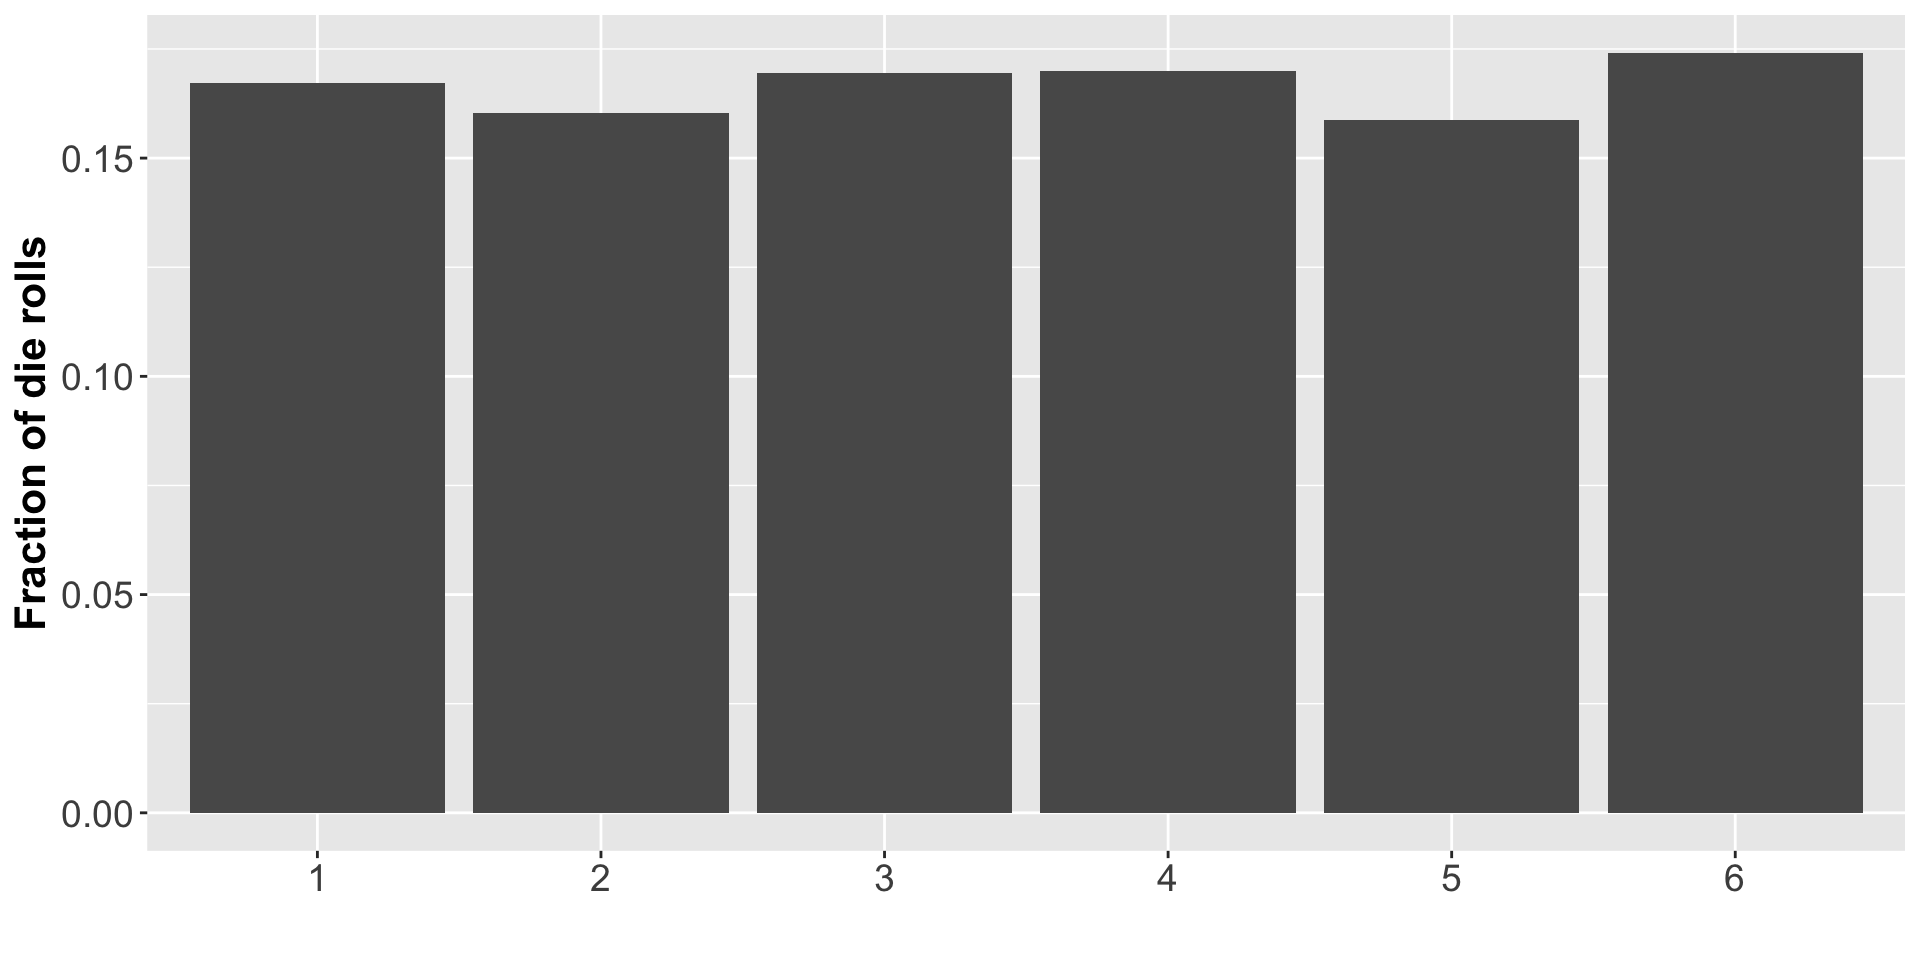
- \(p(6)\) for a fair six-sided die?
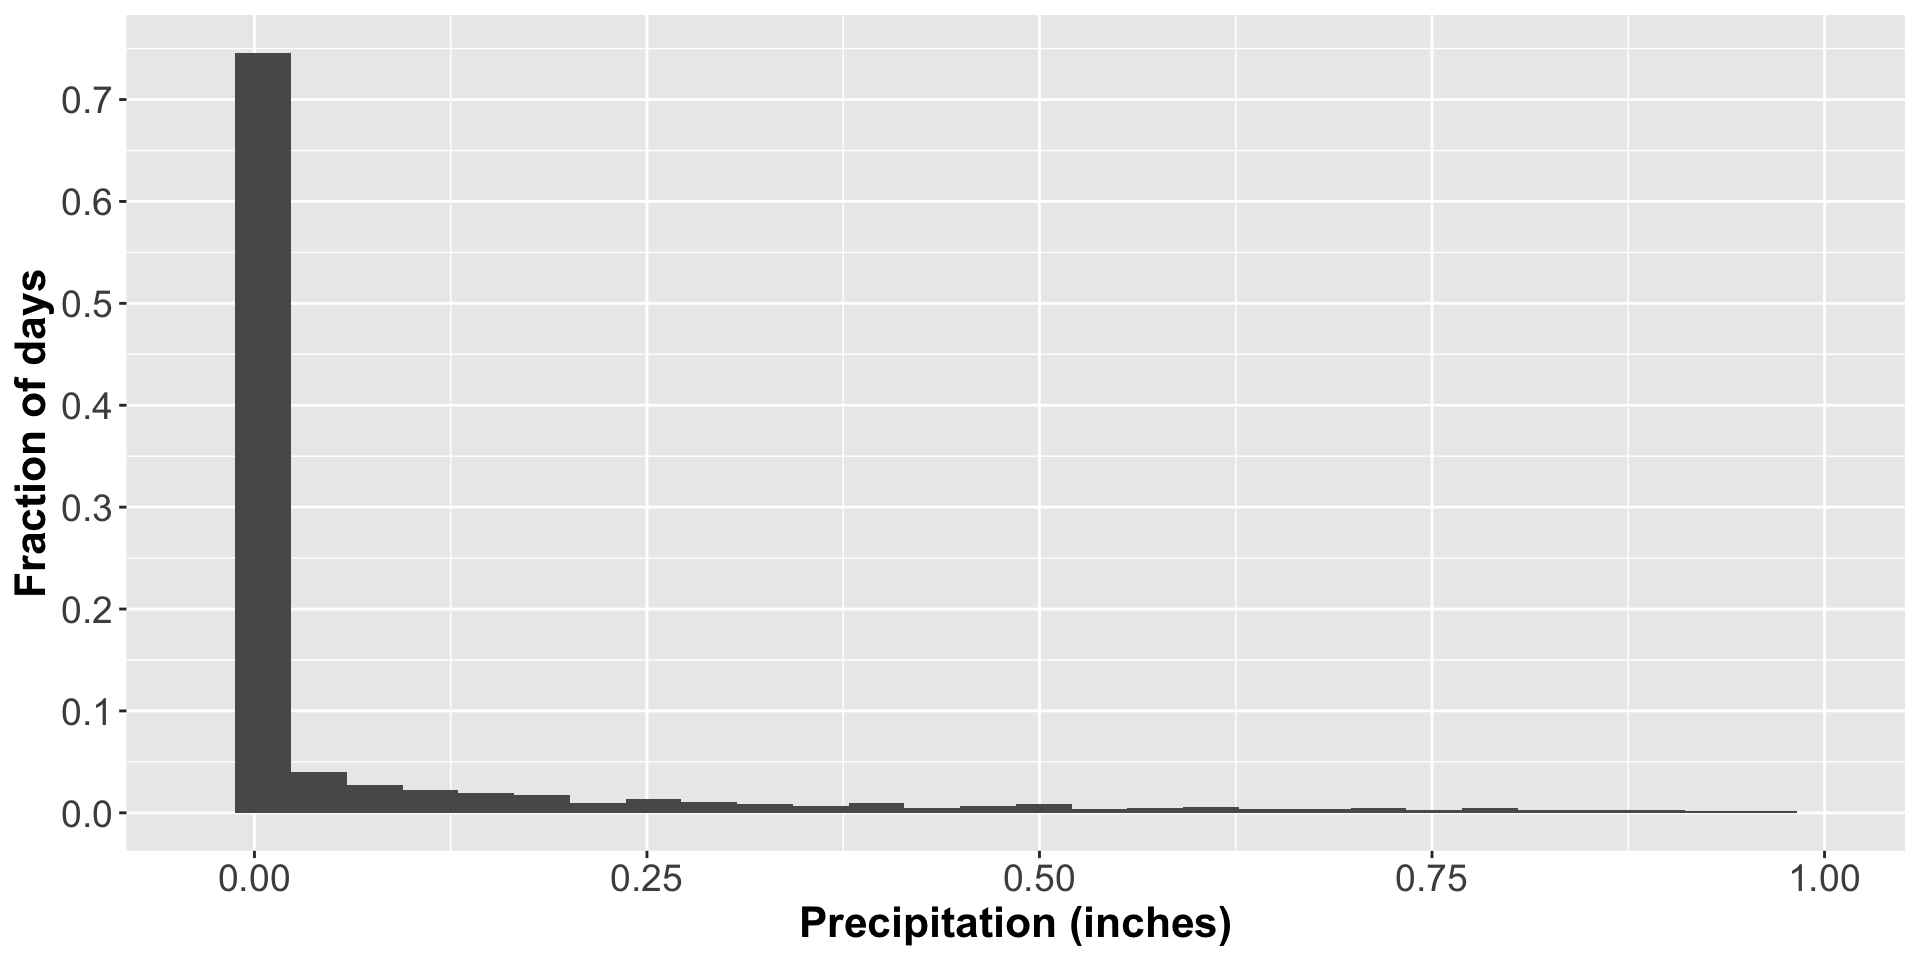
- \(p(\text{Rainfall 20016} > 0)\)?
Flipping a fair coin
Rolling a fair die
Rainfall in 20016
What is data?
Examples
Key definitions
- Data
- Unit of analysis
- Variable
What does data look like?
What does data look like?
| Roll Result |
|---|
| 4 |
| 6 |
| 1 |
| 4 |
| 2 |
| 3 |
| 1 |
What does data look like?
| Flip Result | Heads? |
|---|---|
| Heads | 1 |
| Heads | 1 |
| Tails | 0 |
| Heads | 1 |
| Tails | 0 |
| Tails | 0 |
| Tails | 0 |
What does data look like?
| Date | Precip (in) | Temp (min) | Temp (max) |
|---|---|---|---|
| 1948-08-01 | 2.68 | 68 | 82 |
| 1948-08-02 | 0.26 | 67 | 86 |
| 1948-08-03 | 0.00 | 71 | 87 |
| 1948-08-04 | 1.71 | 69 | 87 |
| 1948-08-05 | 0.00 | 66 | 76 |
| 1948-08-06 | 0.00 | 54 | 77 |
| 1948-08-07 | 0.00 | 56 | 80 |
Why use data?
- A powerful way to answer questions and draw conclusions, particularly about repeated behaviors or large groups
- But to do that we need to map abstract concepts to measurable quantities
Exercise: operationalization
- Military power / capability
- Freedom of speech
- Poverty
- Trauma
- Mental health
How does the data capture the concept? And how well?
Measurement metrics
- Categorical
- Binary
- Continuous
- (We will mostly sidestep count variables)
Reliability and validity
Random variables
- A measure of probabilistic or uncertain process
- Specific realizations of an event captured on real number line
- E.g. daily max temp at BWI
Data generating process
- Underlying process that yields specific realized vaules of RV
- E.g., combined meteorological forces that determine temperature like
- solar radiation
- surface albedo
- atmopheric composition
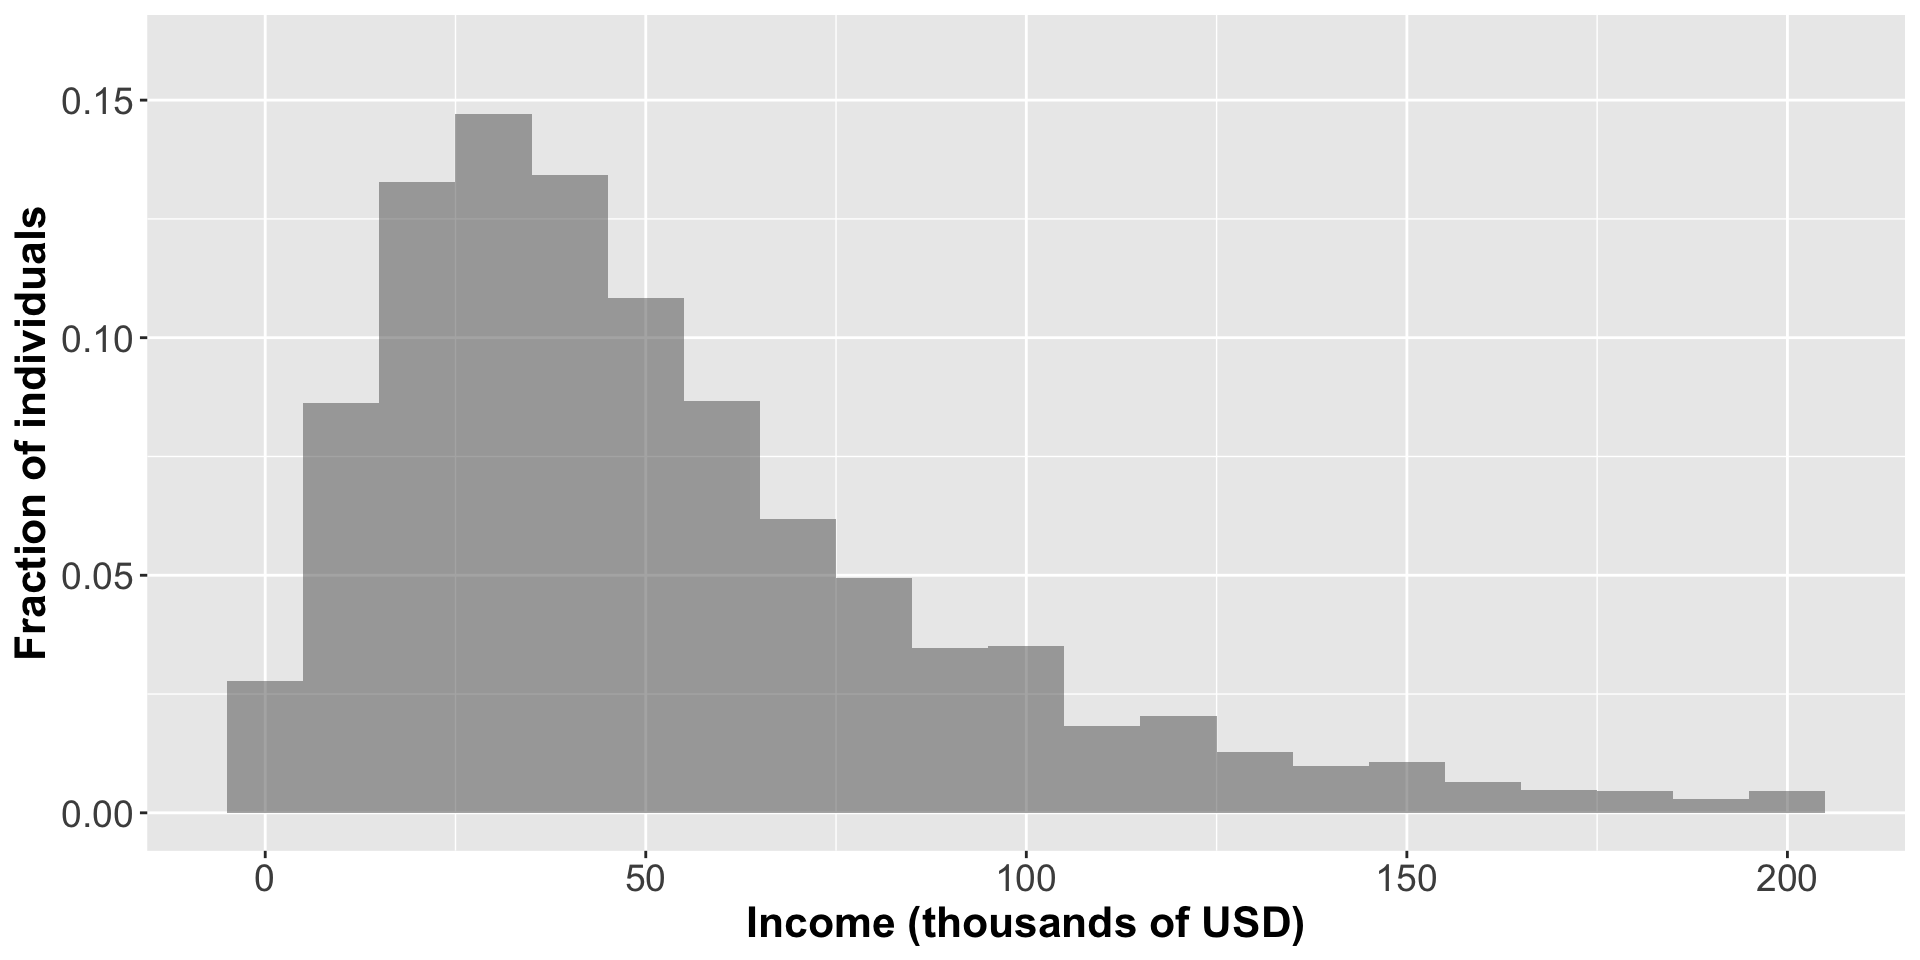
Probability distribution
- Precise specification of probability of event or range of events
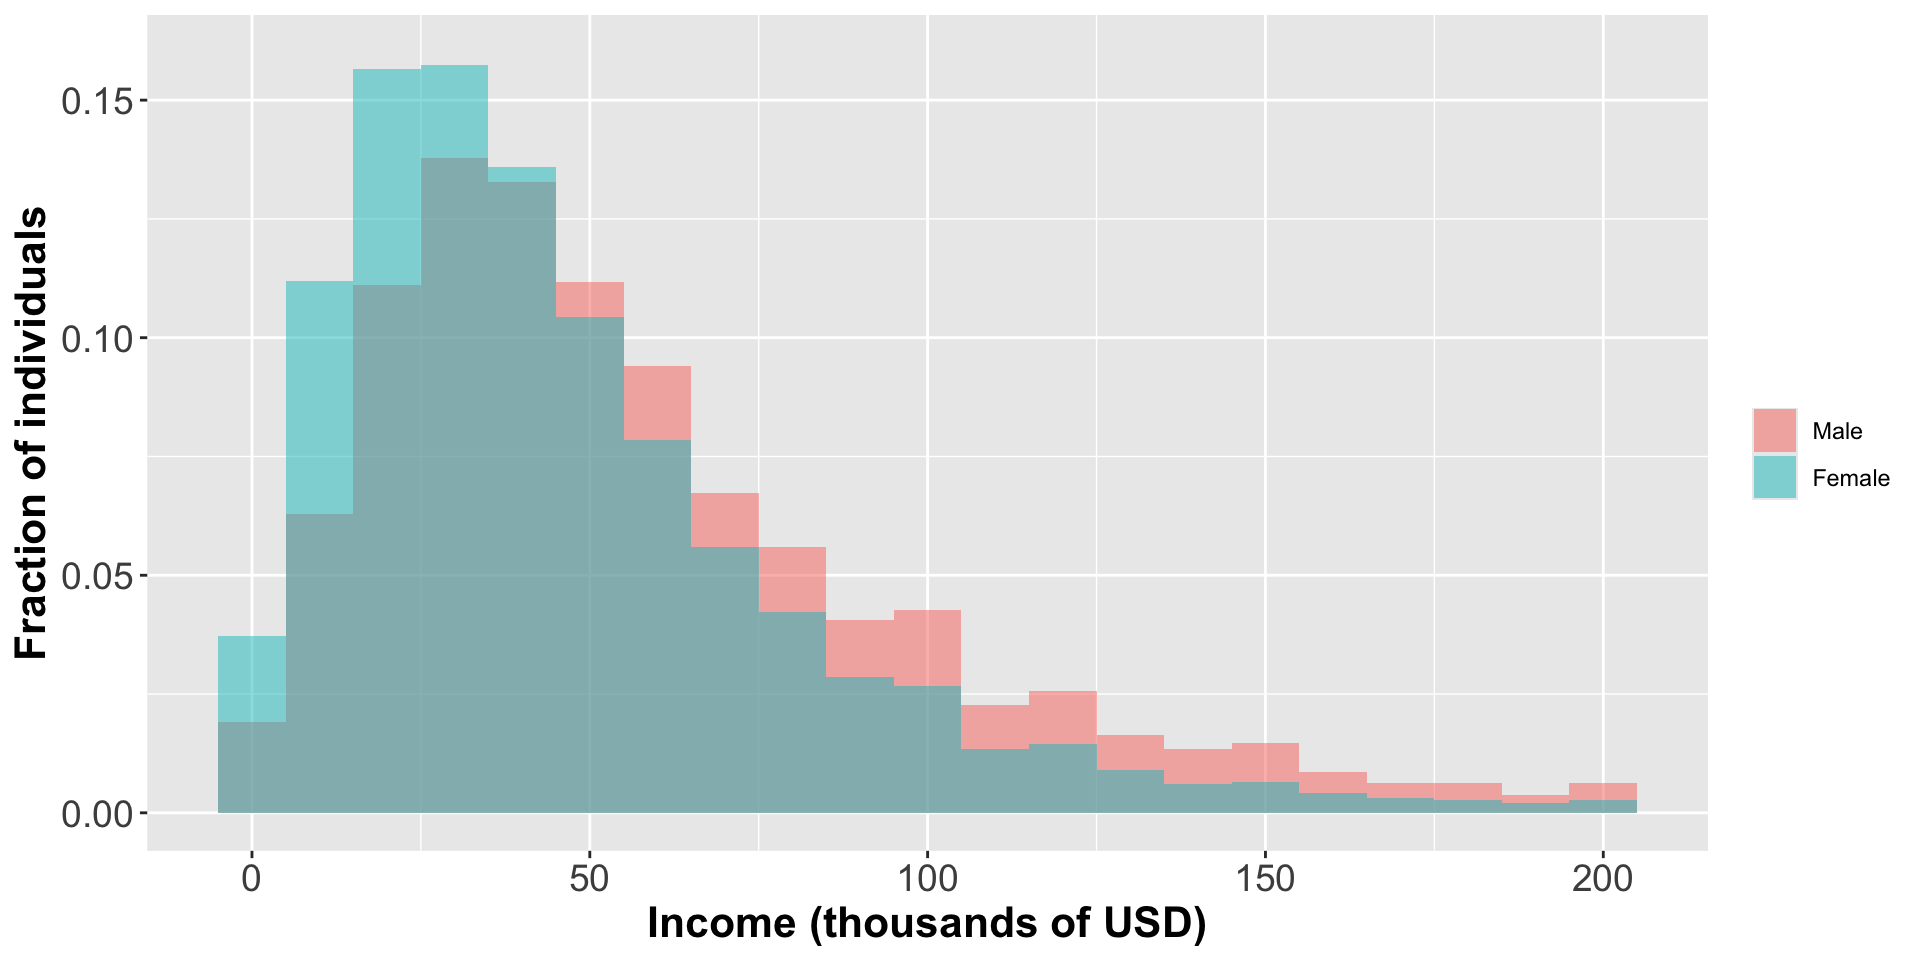
- Often expressed graphically to show likelihood of possible realizations of random variable
- Appropriate representation depends on values variable can assume
- Continuous vs. categorical
- Bounded vs. unbounded
- Can take any shape such that the total area sums to 1
- Area of subregions measures probability of ranges of events
Probability distribution
Total incomes of working people in 2019 ACS
Probability distribution
Total incomes by gender
A data generating process
- F indicates female gender
- D indicates discrimination
- A indicates “ability” or productivity
- O indicates occupation
- Y indicates income
Let’s get our hands dirty!

Thinking like R
- Scripts
- Objects
- Functions
- Packages / libraries
Preview of next time
Describing distributions using real data
Questions to ponder
- How could you visually summarize the mental health of CBPS respondents?
- How could you visually compare the mental health between refugees and members of the host community? Men and women?
- If you had to guess, what do you think that comparison would show?
- Assume your guess is correct, what are some policy implications?